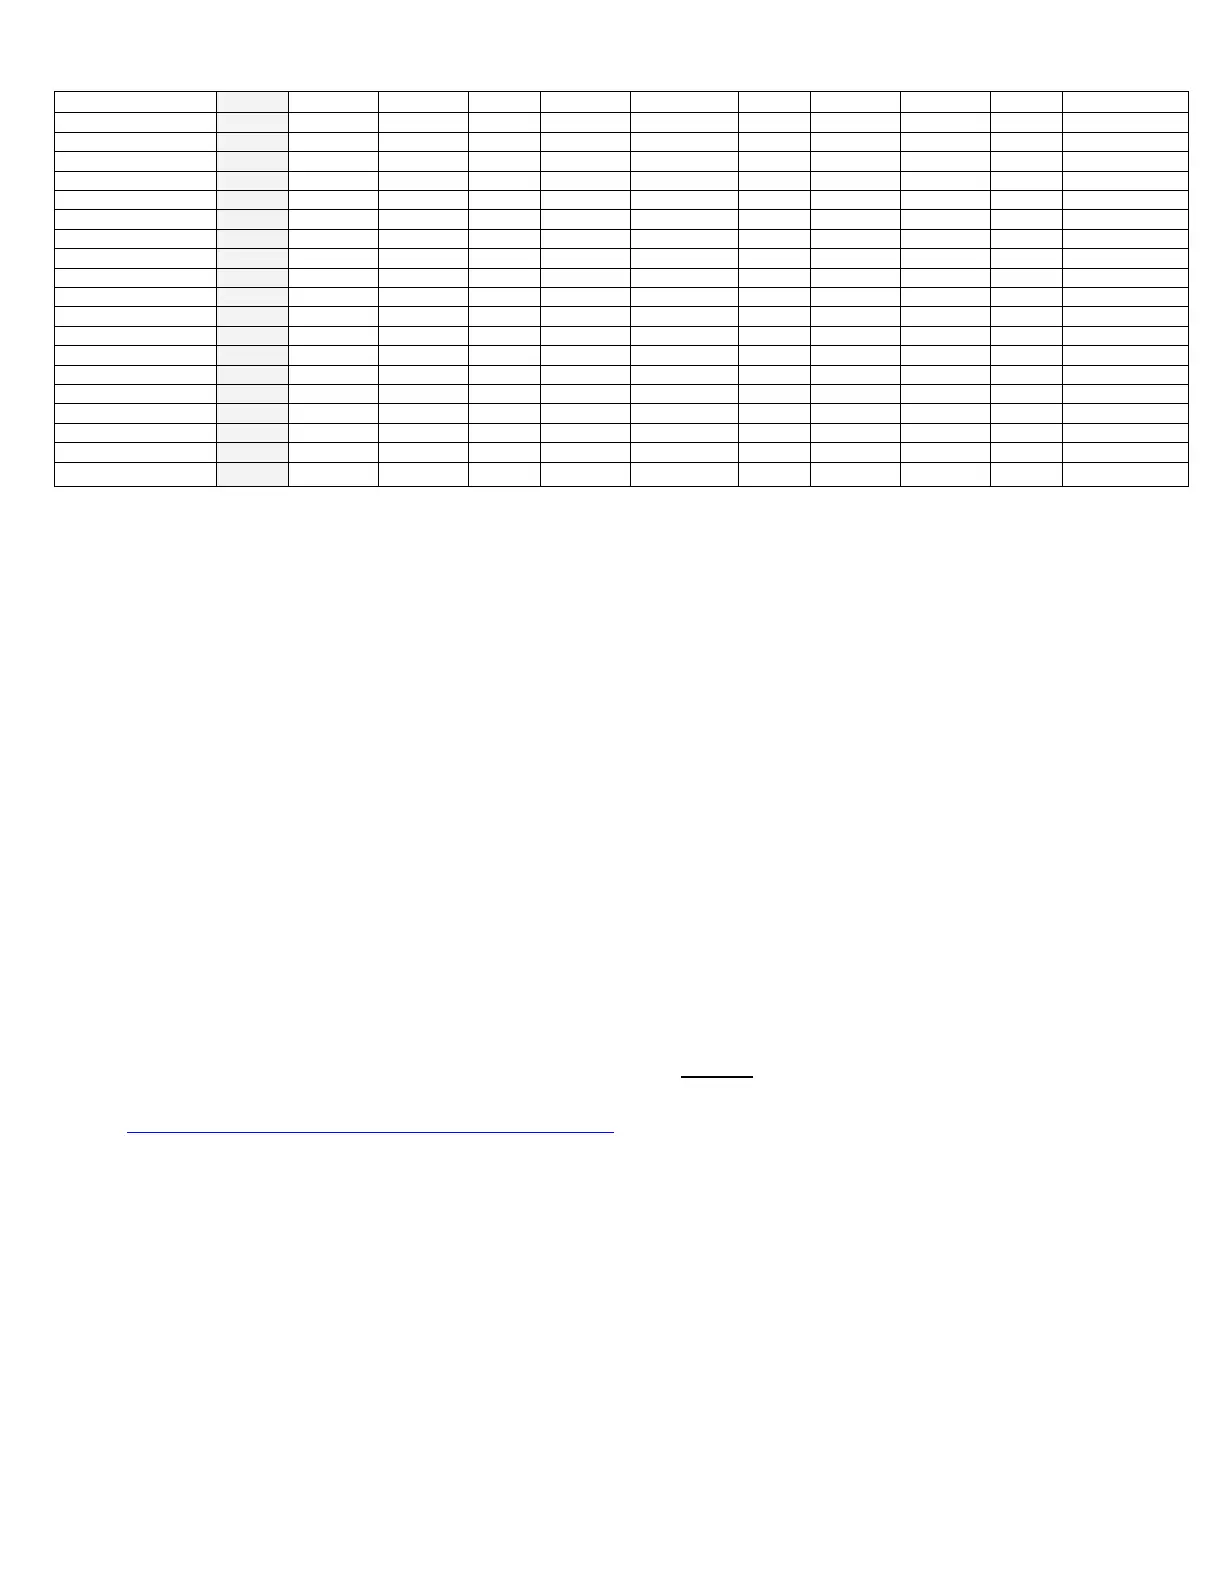
*ALLOY SEPARATIONS CHART
* TE Readings for reference only. Subject to customer’s independent evaluation and testing for
suitability. The TE readings in the above chart are reflective of actual results of metal samples, but may
not necessarily reflect results observed in the field. The readings included in this chart are intended to
be used as a reference to aid the instrument user in determining the efficacy of the Thermo-Electric
Method.
LIMITATIONS
Thermoelectric response is inherently a comparison method of identification because individual
elements cannot be quantitatively determined. Some alloys differ only slightly in one or two
elements and the change in voltage on the tester is too slight to produce a different reading.
Some alloys have elements in them which may offset one another to produce nearly identical
readings overall. Alloys of identical chemical makeup but with different physical hardness
structure usually have different readings.
Additionally, the thermoelectric response procedure cannot differentiate between Stainless
Steel 316 and 304. The Spotter 316 can do the job. For more information, check out
https://www.koslow.com/select_metal_test_kit.
 Loading...