Figure 3-8. LJlogger HTML Configuration
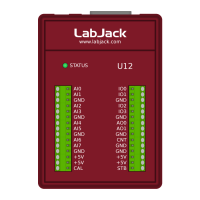
Figure 3-9. LJlogger Trigger Configuration
Figure 3-9 shows 9 example triggers:
Trigger #0: If the scaled data from analog input row 7 (Figure 3-5) is greater than 5, then set AO1 to 5 volts. Once triggered,
there is a 10 second delay before it can be triggered again.
Trigger #1: If IO3 is high, set IO2 high. Reset delay is zero so this trigger can occur every iteration (every 0.1 seconds) if IO3
is high.
Trigger #2: If D15 is low, set D14 low.
Trigger #3: If the count is greater than 10,000, set IO1 to an output.
Trigger #4: If it has been 3000 seconds since LJlogger started, set D13 to an output.
Trigger #5: When the PC’s clock is at 15 minute intervals, the status LED will be turned off and an email will be sent.
Trigger #6: Calls FunctionX from function1.dll. If the function returns True, reset the counter. Users can make their own
FunctionX DLLs. See the source code for more information.
Trigger #7: Calls FunctionX from function2.dll. If the function returns True, stop writing data to file.
Trigger #8: Calls FunctionX from function10.dll. If the function returns True, write 1 row to the data file.
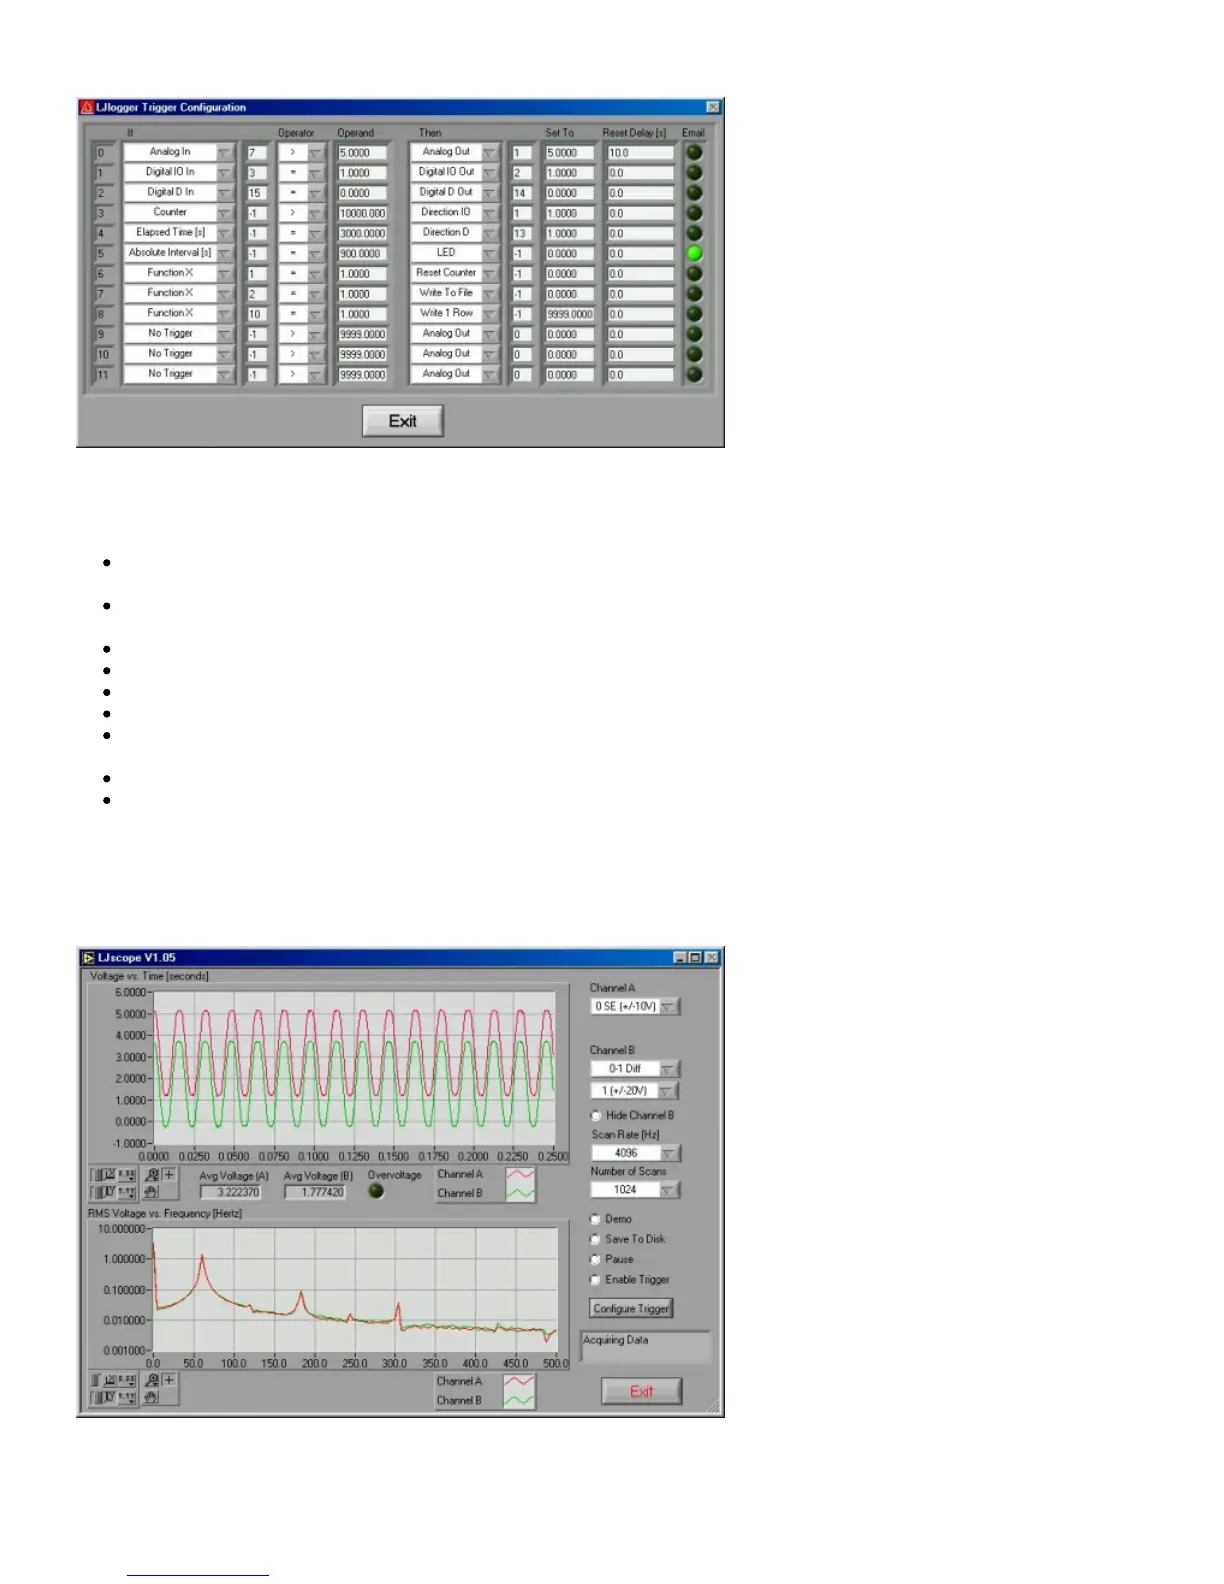
3.5 - LJscope
LJscope simulates an oscilloscope by reading data from 2 analog input channels in burst mode.
Figure 3-10. LJscope
There are two graphs on the LJscope main window (Figure 3-10), which show voltage versus time and voltage versus frequency.
Both graphs have a palette to control various features such as autoscaling and zooming:
 Loading...