– – – –
6
7
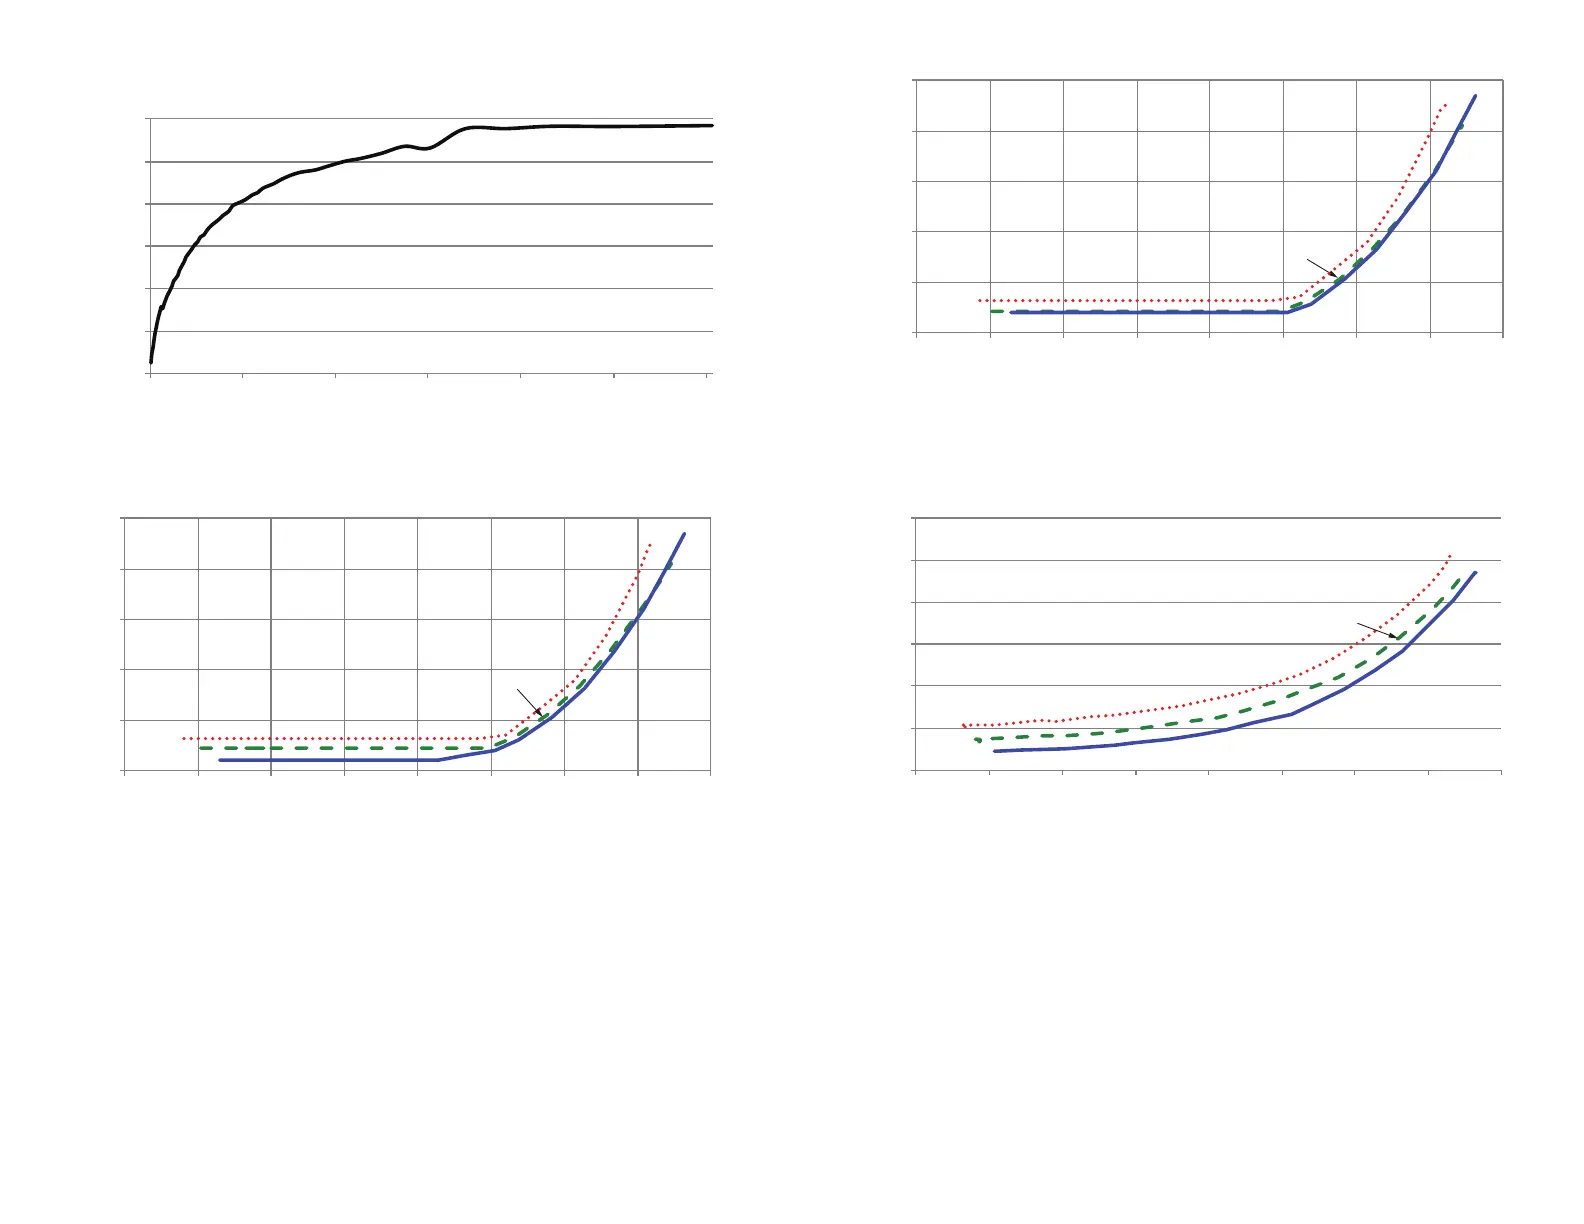
TRM-xxx-TT Typical Performance Graphs
-17.00
-12.00
-7.00
-2.00
3.00
8.00
0 150 300 450 600 750
LVL_ADJ Resistance (kΩ)
Figure 6: TT Series Transceiver Output Power vs. LVL_ADJ Resistance
14
19
24
29
34
39
-25 -20 -15 -10 -5 0510 15
TX Output Power (dBm)
85°C
25°C
-40°C
Figure 7: TT Series Transceiver Peak Current Consumption vs. Transmitter Output Power at 3.3V
Figure 9: TT Series Transceiver Average Current Consumption vs. Transmitter Output Power at 3.3V
12
14
16
18
20
22
24
-25 -20 -15 -10 -5 0510 15
TX Output Power (dBm)
85°C
25°C
-40°C
14
19
24
29
34
-25 -20 -15 -10 -5 0510 15
Supply Current (mA)
TX Output Power (dBm)
85°C
25°C
-40°C
Figure 8: TT Series Transceiver Peak Current Consumption vs. Transmitter Output Power at 5.5V
 Loading...