The mould colonies on the 3M
™
Petrifilm
™
Yeast and Mould
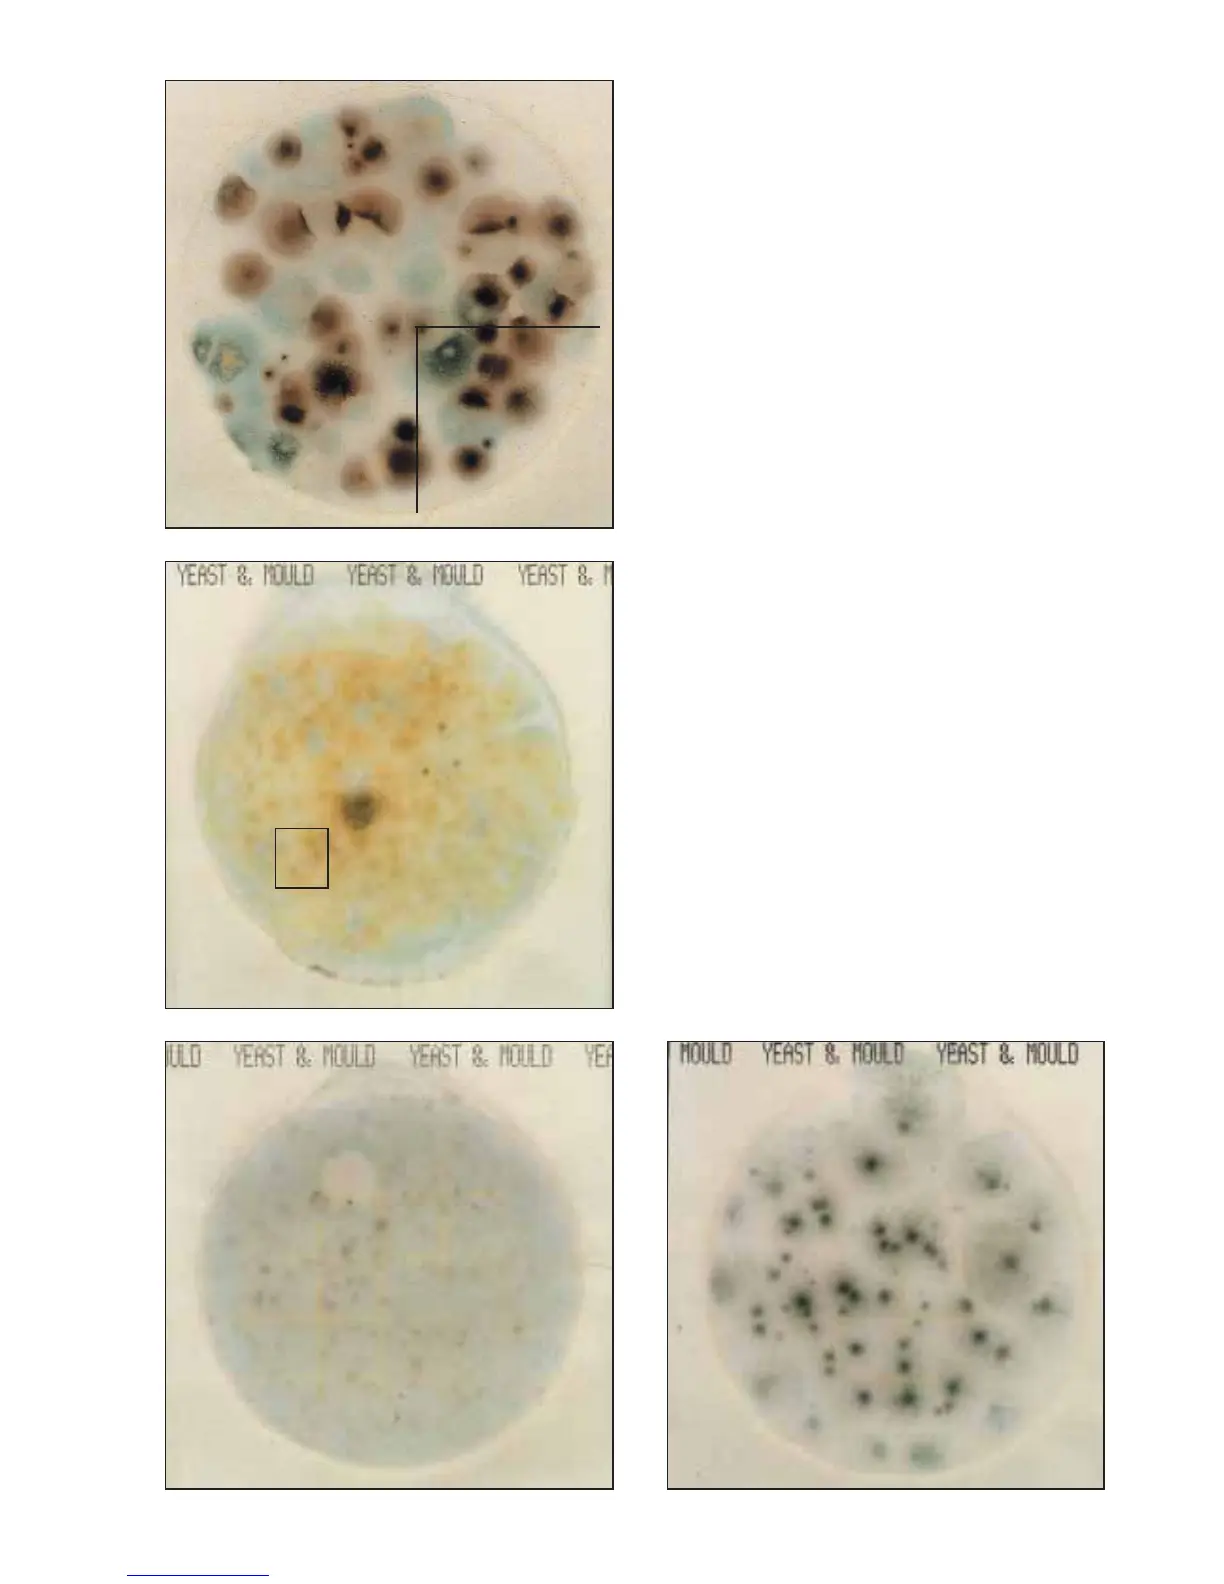
Count Plate in figure 7 are variably pigmented colonies,
with diffuse edges, and centre foci. They are large, and
beginning to crowd, sporulate, and overlap each other on
the plate. For ease in counting, divide the plate into sections
and look for foci to help distinguish individual colonies.
(Mould count = 59) The section shown has 15 moulds.
Note the variable pigmentation, and fuzzy edges of
the plate in figure 8, caused by the high numbers of mould
colonies and sporulation that has taken place. Estimate
the count by counting the foci. There are 4 colonies in
the square shown. (Mould count = 120 estimate)
As with all plate count methods, crowded plates may show
atypical colony characteristics. Proper dilution is important
to ensure an accurate count.
The Petrifilm Yeast and Mould count plates in figures 9
and 10 are 1 : 10 and 1 : 100 dilutions respectively, of the
same product. The colonies in the figure 9 are small, faint
and numerous making the count difficult to estimate.
An artifact bubble is present. (Mould count = TNTC)
Dilution of the product to obtain a colony count within
the desired counting range (15-150 colonies), makes
counting easy. The moulds in figure 10 are large, with
diffuse edges and centre foci. (Mould count = 58).
The over-crowding on the plate in figure 9 prevented
their typical growth.
Moulds
Mold count = 59
Figure 7
Mold count = 120 (estimate)
Figure 8
Mold count = TNTC
Figure 9
Mold count = 58
Figure 10
 Loading...