Activity Graphs [coming soon on Android]
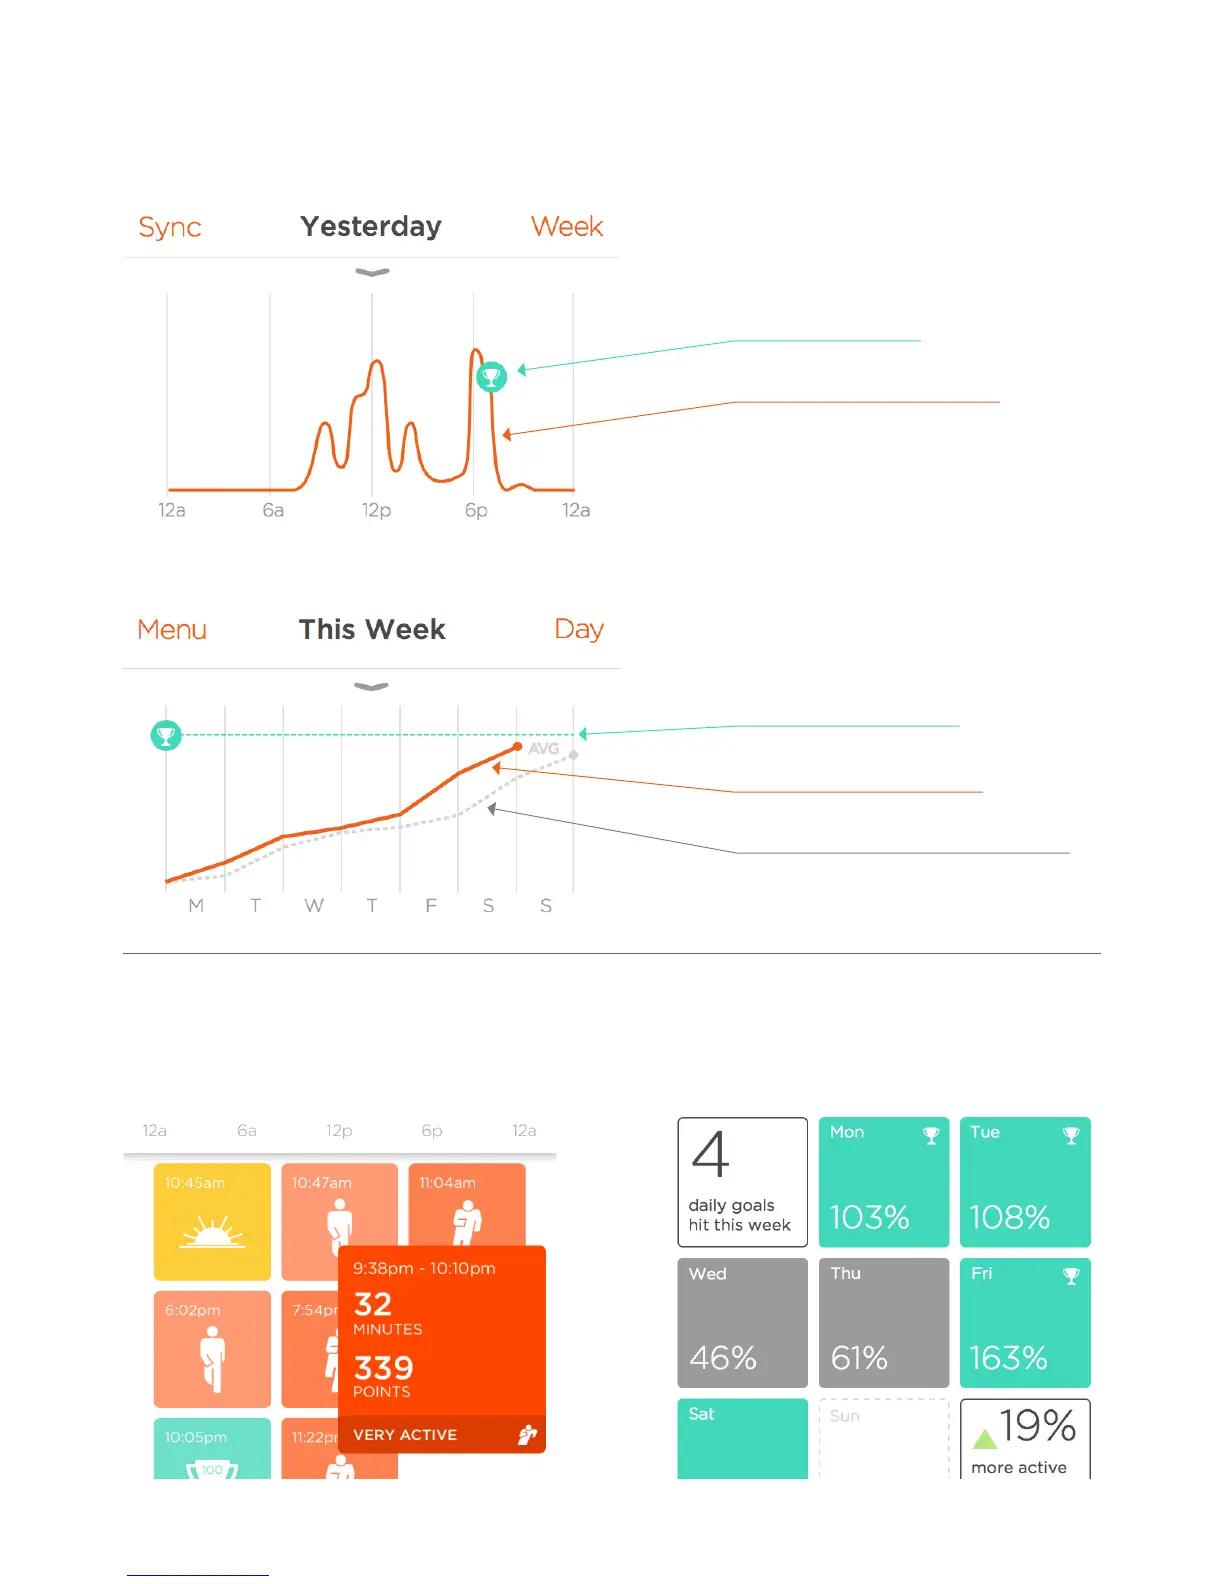
Intensity graph:
The intensity graph shows your activity level over the course of 24 hours.
Trend chart:
The trend chart shows your activity progress over the course of a week.
Highlights [coming soon on Android]
The highlights panel collects notable activity
events during your day, including activity sessions,
sleep sessions, milestones, achievements and more.
Grey dotted line: average activity progress
Green line: your activity goal
Orange line: current week progress
Orange line: current activity progress
Green trophy: goal met!
Weekly Summary -
In the week view, the highlights panel
becomes a summary of your weekly
activity level and performance over time.
You can tap on a tile to see more details
12