Instructions for use
CLIMACELL EVO_np_en_1401_mmm_V1.01 33
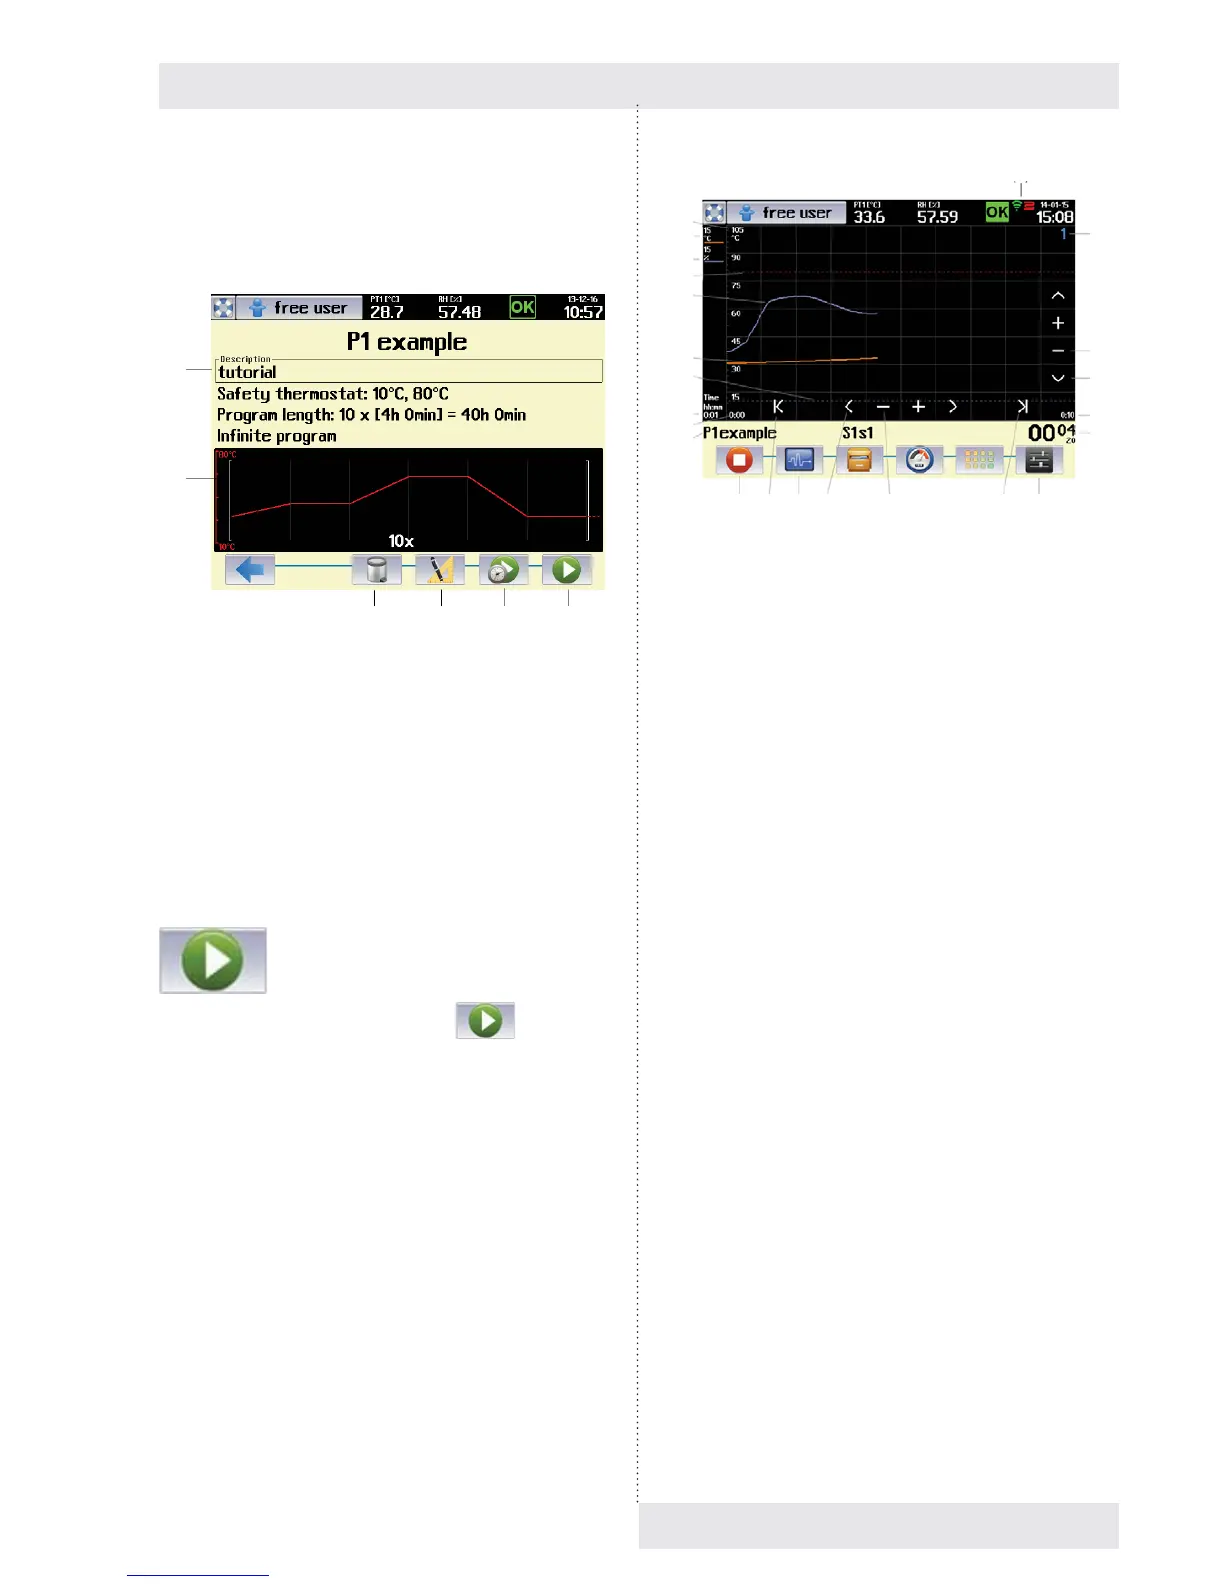
8.4.6 PROGRAM START MENU
After all the segments setting and program saving we
reach the menu where it is possible to start the program
respectively to further adjust it.
Fig. 60
(1) Basic data of the program.
(2) Schematic display of the program course.
(3) Program deletion.
(4) Program adjustment.
(5) Delayed program start.
(6) Program start.
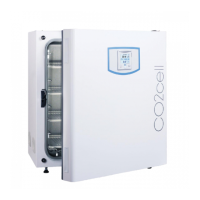
8.4.7 PROGRAMU START
The program is started by push button
, Fig. 60.
The display starts to show graphic displaying of the program
items depending on time (Fig. 61). The upper bar shows
current values of temperature and relative humidity in the
chamber.
(1)
(2)
(3) (4) (5) (6)
Fig. 61
(1) Vertical axis description – the axis for currently
displayed item (temperature).
(2) Description of vertical axis for the fi rst item
(temperature).
(3) Description of vertical axis for other items (humidity,
CO
2
, etc.)
- By touching the axis description there will be
switched over the vertical axis for the relevant
item.
(4) Protective thermostat setting – upper limit.
(5) Graphic record of second item regulation (humidity).
(6) Graphic record of fi rst item regulation (temperature).
(7) Protective thermostat setting – lower limit.
(8) Time axis description – format and scale.
- The scale is in the format of time / one graph
section.
- In our example 1 min. / section.
(9) Start of displayed time section.
- In our case there is displayed the course of
regulation in the range from 0:00 hour to 0:10 hour
as from the program start.
(10) Information on active program and segment. Field for
operation reports
(11) Stop the program.
(12) Push button for movement to the beginning of record.
(13) Program editing.
(14) Movement backward / forward
- Based on touch, the displayed fi eld of the graph
moves in the direction of negative (positive) time
axis.
(15) Change of time axis scale.
- „-“ displays a longer time interval.
- „+“ displays a shorter time interval.
(16) Push button for movement to the end of record.
(17) Graph setting (see 8.4.7.1).
(18) Displaying the time data of the program (see 8.4.7.1).
- The format of displaying depends on setting them
graph parameters - see 8.4.7.1.
- c – it has the meaning of the number of fi nished
cycles.
(1)
(2)
(3)
(4)
(5)
(6)
(7)
(8)
(9)
(10)
(11) (12) (13) (14) (15) (16) (17)
(23)
(22)
(21)
(20)
(19)
(18)