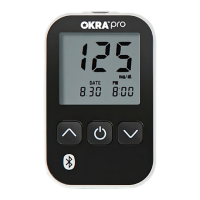
OKRA OKRA
82
83
Regressions between OKRA Pro BGMS results and the YSI 2300 for the capillary whole
blood samples:
Precision Results for venous whole blood samples.
The study shows that the OKRA Pro glucose monitoring
system compares well with the laboratory method.
Precision
Linear regression 95% CI Slope 95% CI Intercept R
2
N
y= 0.9886x - 0.3843 (0.978, 0.999) (-2.610, 1.842) 0.9916 300
Blood Conc.
Level
N 44 mg/dL 83mg/dL 125 mg/dL 208 mg/dL 332mg/dL
grand mean 300 43 81 127 209 332
pooled
variance
300 2.4 4.4 11.7 27.9 76.3
pooled
SD
300
1.6 2.1 3.4 5.3 78.7
95% CI (1.57, 1.63) (2.04, 2.16) (3.33, 3.47) (5.18, 5.42) (8.53, 8.87)
pooled CV
(%)
300 3.7 2.6 2.7 2.5 2.6
Precision Results for control solutions.
Control Solution Level N 45 mg/dL 111 mg/dL 307mg/dL
grand mean 600 51 111 311
pooled variance 600 4.8 7.5 60.2
pooled SD 600 2.2 2.7 7.8
95% CI 600 (2.18, 2.22) (2.26, 2.73) (7.67, 7.93)
pooled CV (%) 600 4.3 2.4 2.5
Alternative Site Testing Accuracy
The OKRA Pro glucose monitoring system was evaluated for alternative site testing
accuracy by comparing blood glucose results of alternate sitesmeasured by patients
and health professionals using OKRA Pro glucose monitoring system, and the results
measured by the YSI 2300 Autoanalyzer, a laboratory instrument. Glucose levels were
measured on 150 fresh capillary specimens at three dierent clinical centers.