ETuivalent CO2 emissions for amount of electricity in use at that
time (KG)
TOTAL ETuivalent CO2 emissions for total amount of electricity used
from display first setup or when last reset to zero (KG)
H,STOR< ETuivalent CO2 emissions for total amount of electricity used so
far This Day Week Month and electricity used for Last Day
Week Month (KG)
Displays eTuivalent CO2 emissions for average daily, weekly and
monthly amount of electricity used (KG).
This Day Total use so far this since midnight
This Week Total use so far this week from midnight on Monday
Total use so far this month from midnight of 1
st
of the month
Last Day Total used yesterday
Total used for the previous week
Last Month Total used for the previous month
Day Calculated over last 30days usage
Calculated over last 60days usage
Month Calculated over last 90days usage
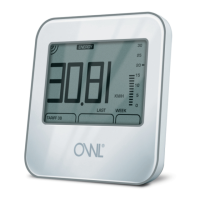
micro+
WIRELESS ELECTRICITY MONITOR
18
2 Save Energy Limited
Chineham Lane, Basingstoke, Hants, RG24 9LR
www.theowl.com customer.services@theowl.com