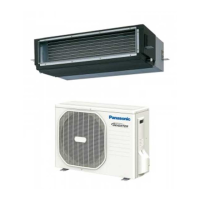
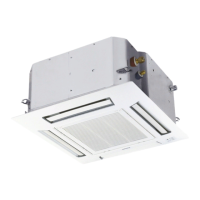
17. Slim Low Static Ducted Type (M1 Type)
Strong
Weak
Both 50Hz and 60Hz
MODEL : S-45MM1E5
32 dB(A)
28 dB(A)
:SOUND LEVEL 34 dB(A)STRONG
400063 125 250 800020001000500
Frequency at center of sound pressure band (Hz)
Overall
400063 125 250 800020001000500
Frequency at center of sound pressure band (Hz)
Overall
60
50
40
30
20
10
Sound pressure level (dB)
(0dB = 0.0002μbar)
Approximate
minimum
audible limit for
continuous noise
MODEL :
:
:
S-36MM1E5
SOUND LEVEL
WEAK
CONDITION
STRONG
1.5 m directly below unit
MODEL
:
:
:
S-56MM1E5
SOUND LEVEL 35 dB(A)
WEAK 31 dB(A)
CONDITION
STRONG
1.5 m directly below unit
:CONDITION
1.5 m directly below unit
60
50
40
30
20
10
Sound pressure level (dB)
(0dB = 0.0002μbar)
Approximate
minimum
audible limit for
continuous noise
WEAK 30 dB(A)
Sound pressure level (dB)
(0dB = 0.0002μbar)
60
50
40
30
20
10
Frequency at center of sound pressure band (Hz)
400063 125 250 800020001000500
Overall
Approximate
minimum
audible limit for
continuous noise
MODEL : S-28MM1E5
28 dB(A)
25 dB(A)
:SOUND LEVEL 30 dB(A)STRONG
400063 125 250 800020001000500
Frequency at center of sound pressure band (Hz)
Overall
60
50
40
30
20
10
Sound pressure level (dB)
(0dB = 0.0002μbar)
Approximate
minimum
audible limit for
continuous noise
MODEL :
:
:
S-15MM1E5 / 22MM1E5
SOUND LEVEL
WEAK
CONDITION
STRONG
1.5 m directly below unit
:CONDITION
1.5 m directly below unit
WEAK 27 dB(A)
Sound pressure level (dB)
(0dB = 0.0002μbar)
60
50
40
30
20
10
Frequency at center of sound pressure band (Hz)
400063 125 250 800020001000500
Overall
Approximate
minimum
audible limit for
continuous noise
1.5 m
Air discharge
(Low Silhouette Ducted Type)
Air intake
Unit
1.5 m directly below unit
Auxiliary Duct
of 2 m length
Auxiliary Duct
of 1 m length
REMARKS: 1. Value obtained in the actual place where the unit is
installed may be slightly higher than the values shown
in this graph because of the conditions of operation,
the structure of the building, the backgroundnoise and
other factors.
2. The test results were obtained from an anechoic room.
3. The layout of the testing condition is shown at right.
To evaluate the noise level, the maximum value of the measured sound pressure level is used. Read the value at
each frequency level (on horizontal axis, center of the sound pressure band) from 63 Hz to 8000 Hz, and select the
corresponding maximum value indicated on the vertical axis.
NC-20
NC-30
NC-40
NC-50
NC-20
NC-30
NC-40
NC-50
NC-20
NC-30
NC-40
NC-50
NC-20
NC-30
NC-40
NC-50
NC-20
NC-30
NC-40
NC-50
NOTE
17-4. Noise Criterion Curves

 Loading...


