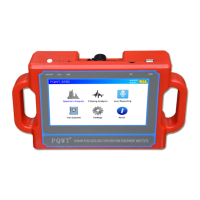
5. After processing the above steps , as shown in Figure 6 below:
Figure 6
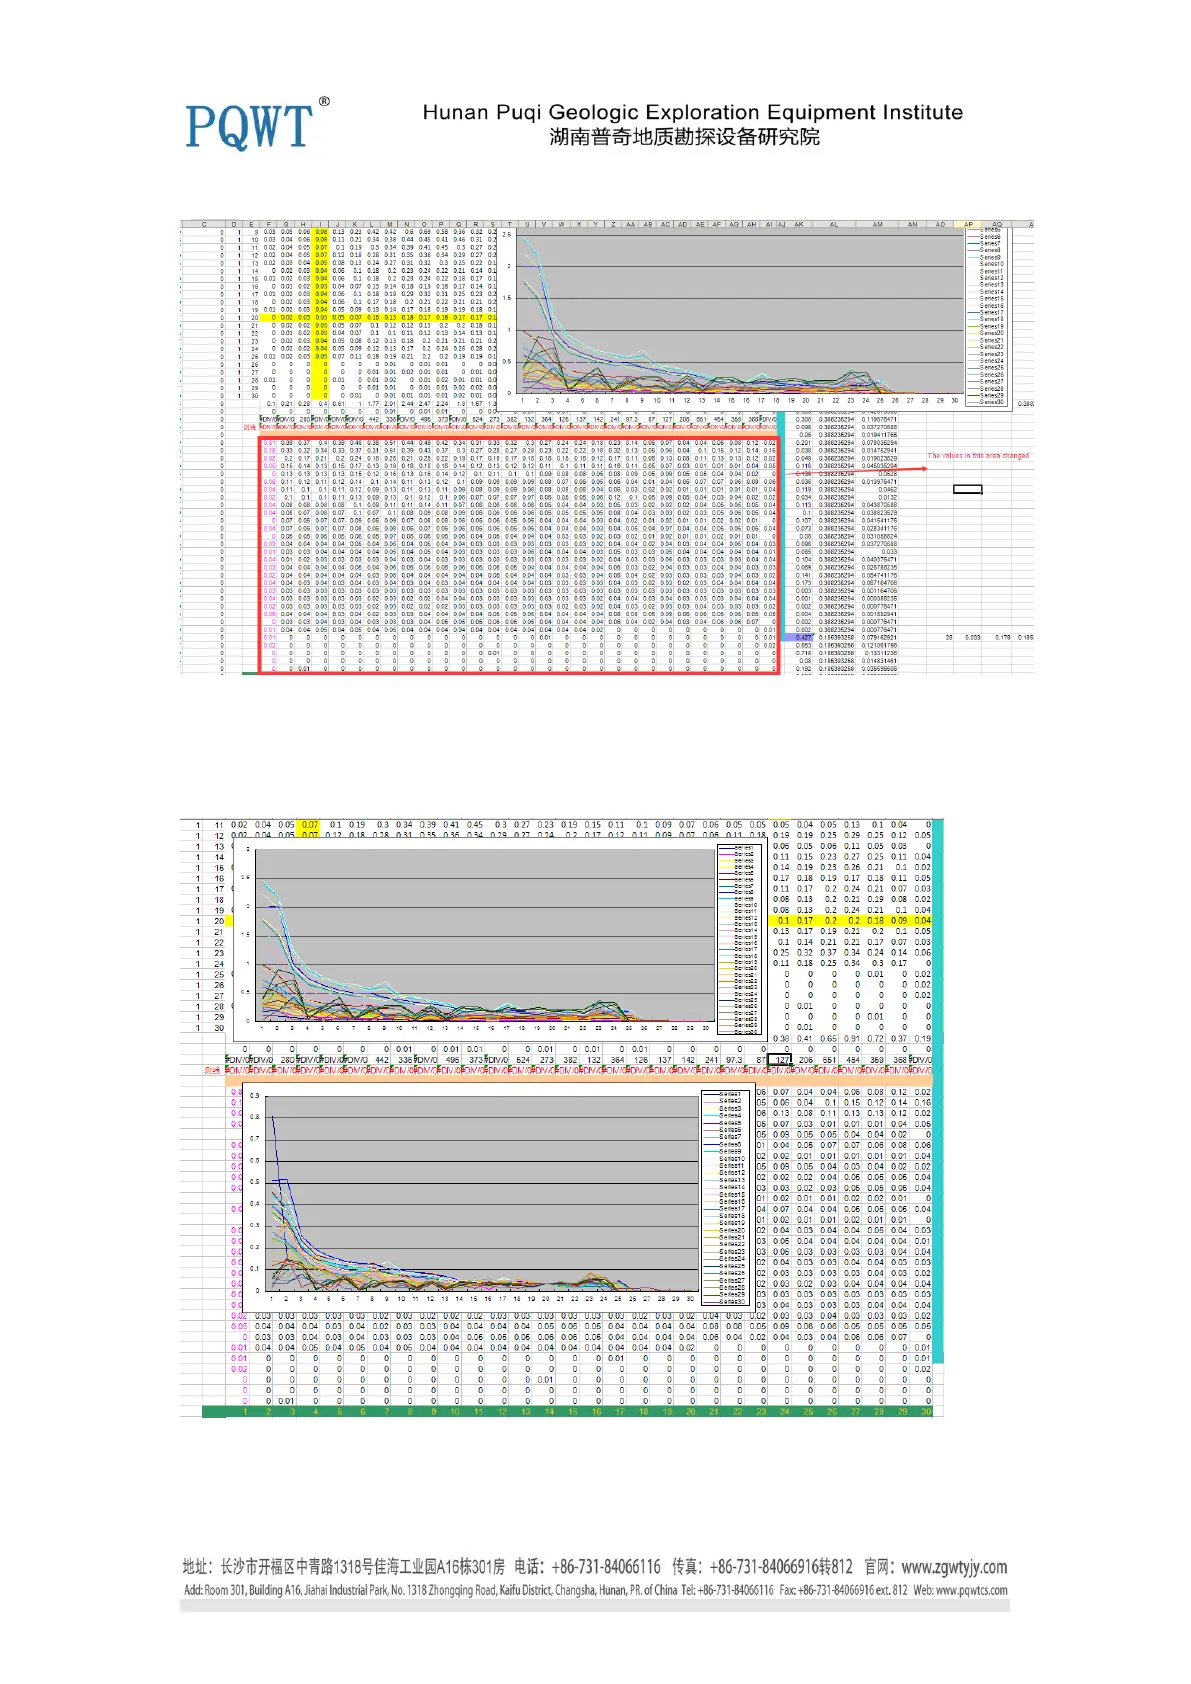
6. Make a Line Chart using the data in red frame above, then compare with the original line chart
as shown below in figure 7,
Figure 7
7. Generally the water area we judge based on low values, but the data above, too many high
values, it covers many low values. We can find that the main values in the area below 0.2, so we
 Loading...