EasyManuals Logo

PQWT PQWT-S Series User Manual

PQWT PQWT-S Series
35 pages
To Next Page IconTo Next Page
To Previous Page IconTo Previous Page
Page #31 background imageLoading...
Page #31 background image
31
need to lower the high values into 0.2 area.
For example, we lower the hig value 0.8 into 0.2, as shown in figure Figure 8,
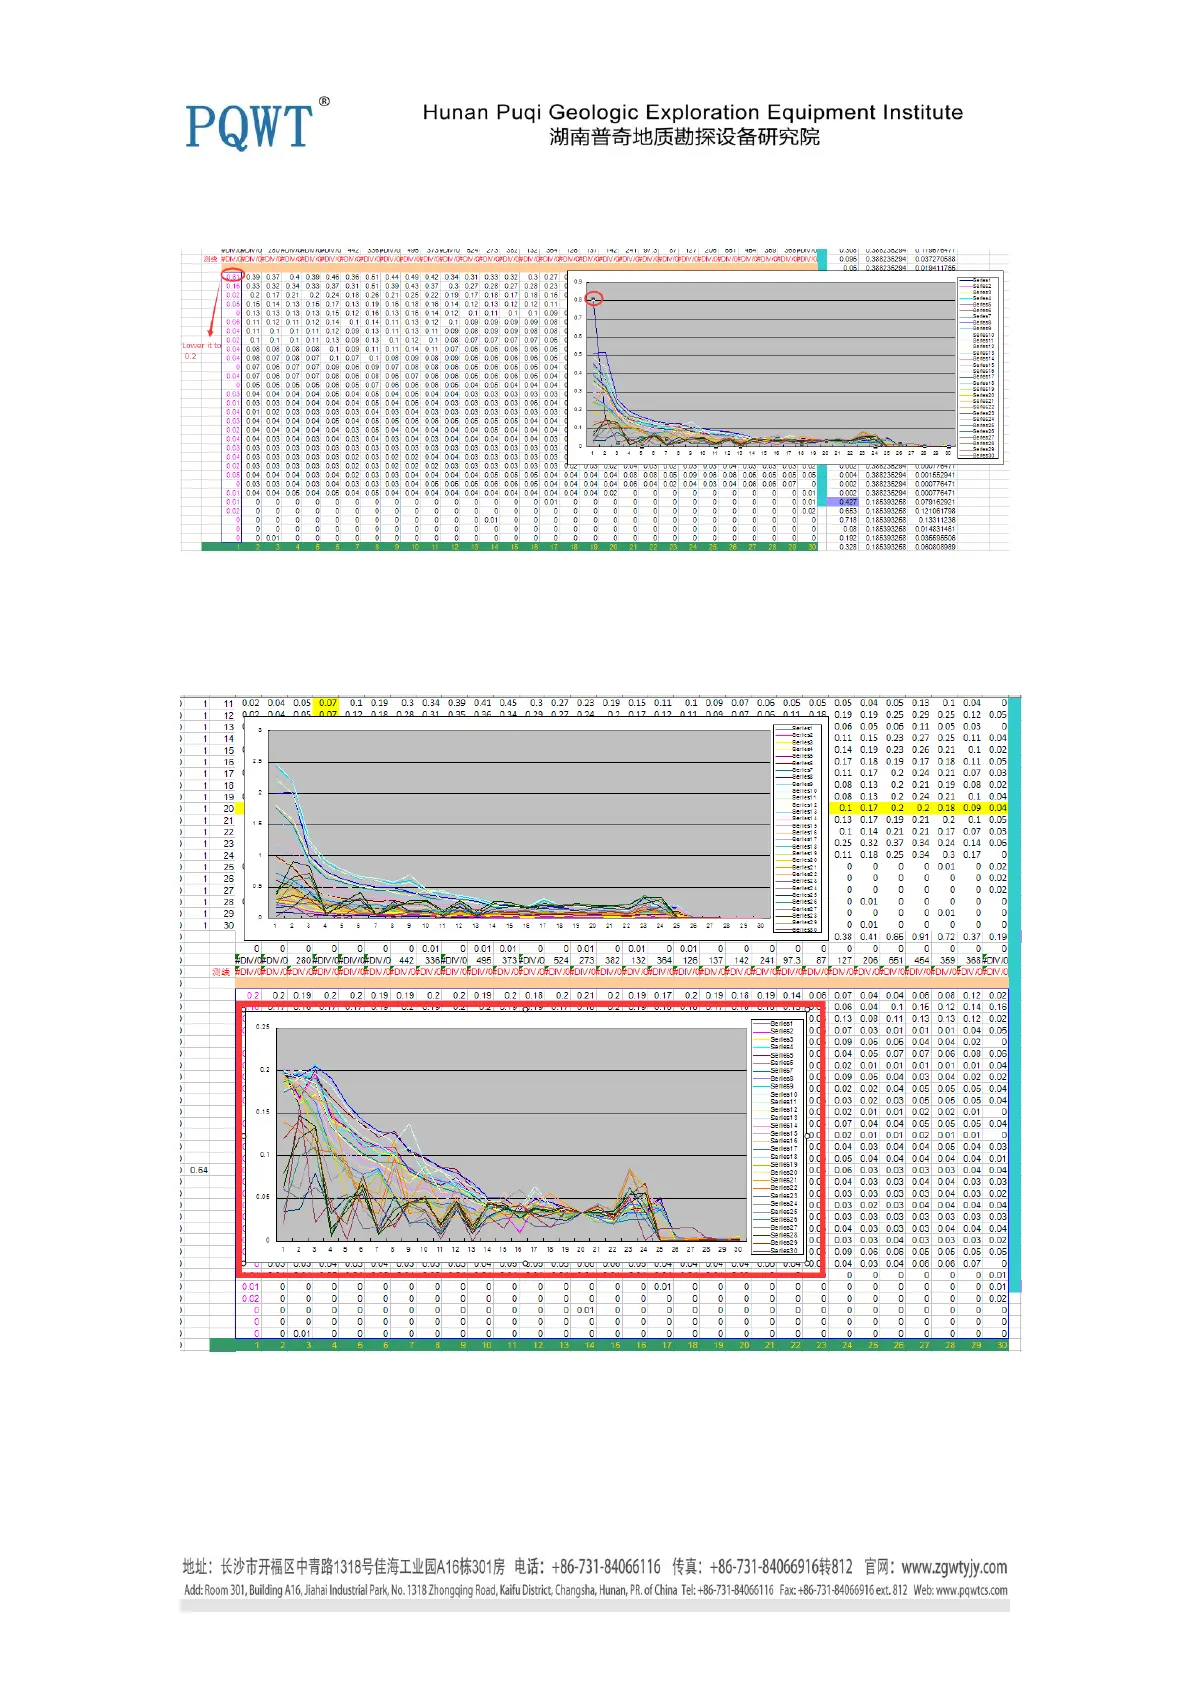
Figure 8
Based on this method, lower other high values into 0.2 area, then the line chart will be changed as
shown below in figure 9, you can find that other low values will be more obvious than the original
one.
Figure 9
8. Then copy the changed data in the red box, through " Paste - value - Transpose " steps to the
green area, as shown in figure 10,

Questions and Answers:

Question and Answer IconNeed help?

Do you have a question about the PQWT PQWT-S Series and is the answer not in the manual?

PQWT PQWT-S Series Specifications

General IconGeneral
BrandPQWT
ModelPQWT-S Series
CategorySecurity Sensors
LanguageEnglish

Related product manuals