63
<Example 4>
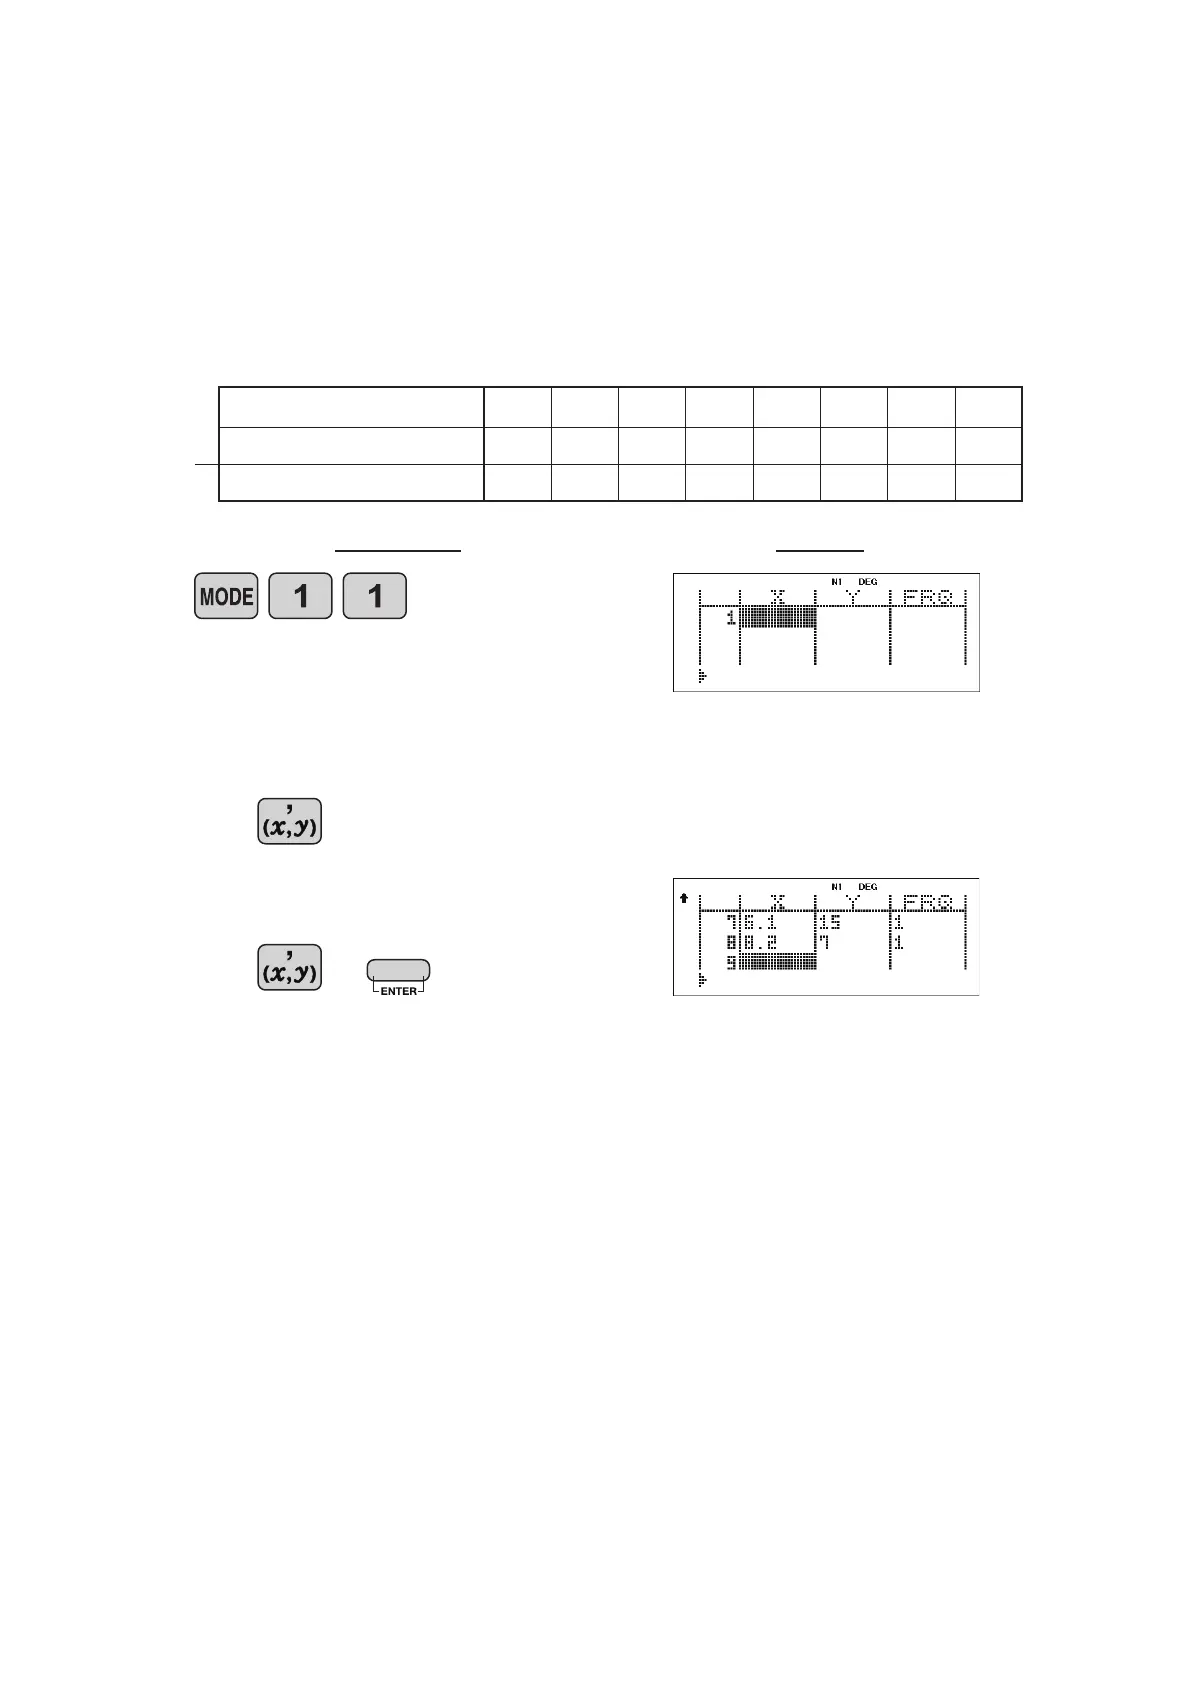
Data table 3
Operation Display
6.2 13
8.2 7
The table below summarizes the dates in April when cherry
blossoms bloom, and the average temperature for March in
that same area. Determine basic statistical quantities for
data X and data Y based on the data table.
Select two-variable statistics mode and
linear regression calculation in sub-mode.
(The input table is displayed.)
2010 2011 2012 2013 2014 2015 2016 2017
6.2 7.0 6.8 8.7 7.9 6.5 6.1 8.2
13 9 11 5 7 12 15 7
Year
x Average temperature
y Date blossoms bloom
.
.
.
DATA INPUT FOR 2-VARIABLE STATISTICS