All and more about Sharp PC-1500
at
http:/lwww.PC-1500.info
SHARP
PROGRAM
T I T L E
I
Out
line J
HISTOGRAM
PROGRAM
NO
.
PS
-
D-7
CE-I
50
required
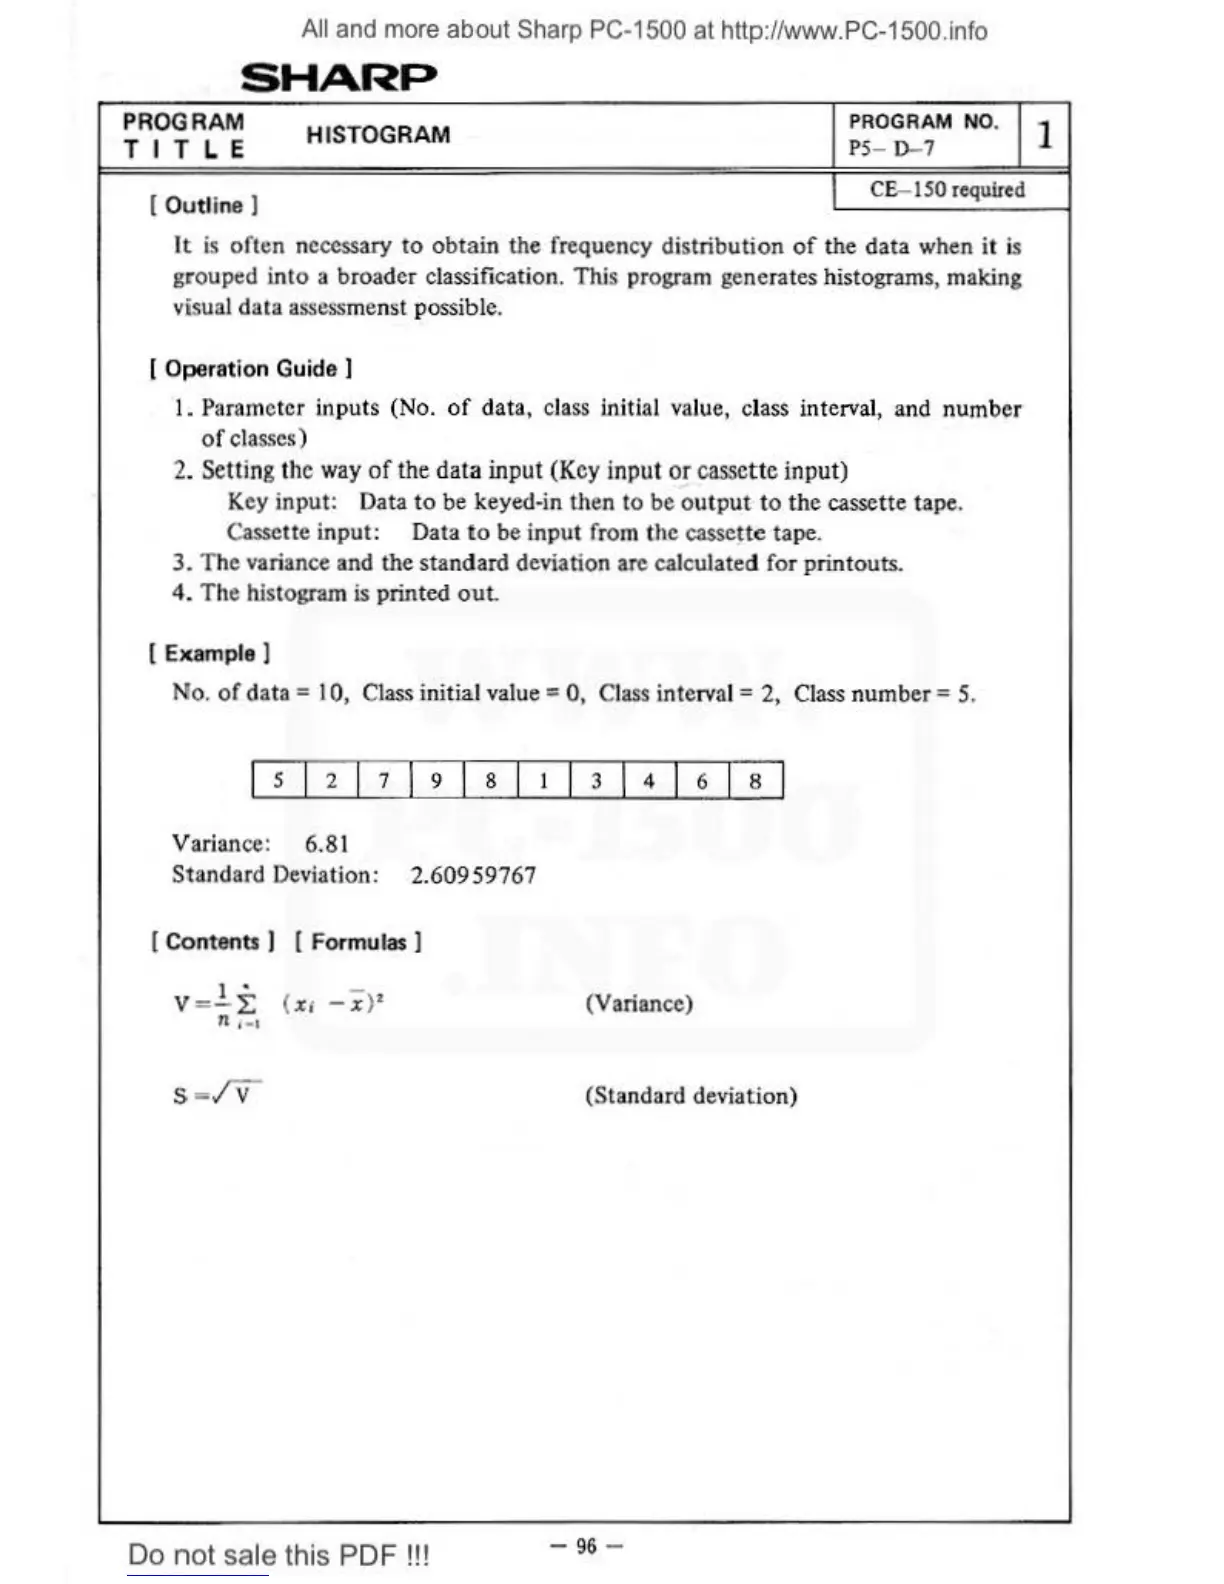
It is often necessary to obtain the frequency distribution
of
the data when it is
grouped into a broader classjfication. This program generates histograms, making
visual data assessmenst possible.
I Operation G
ui
de
I
I.
Parameter inputs (No. of data, class initial value, class interval, and number
of
classes)
2. Setting
th
e way
of
the data input (Key input
or
cassette input)
Key input: Data
to
be keyed-in then to
be
o
utput
to
the cassette tape.
Cassette input: Data
to
be input from the cassette tape.
3.
T
he
variance a
nd
the
stan
dard deviation are calculated
fo
r printouts.
4.
The histogram
is
printed
out.
I Example I
No.
of
d
ata=
I 0, Class initial value = 0, Cl
ass
interva
l=
2, Class number= 5.
Variance: 6.81
Standard Deviation: 2.609 59767
I Contents I [ Formulas I
I •
v =-
I:
{
x;
-i
l'
n ,
..
,
(Variance)
(Standard deviation)
Do
not
sale this PDF !!!
-
96
-
1