All and more about Sharp PC-1 500
at
http://www.PC-1500.info
SHARP
PROGRAM
T I T L E
[ Outline I
GRAPH GENERATION
II
(
BA
R OR
BROKEN
LINE
GRAP
H}
PR
OGRAM
NO
.
PS
- D-9
C
E-
I
SO
required
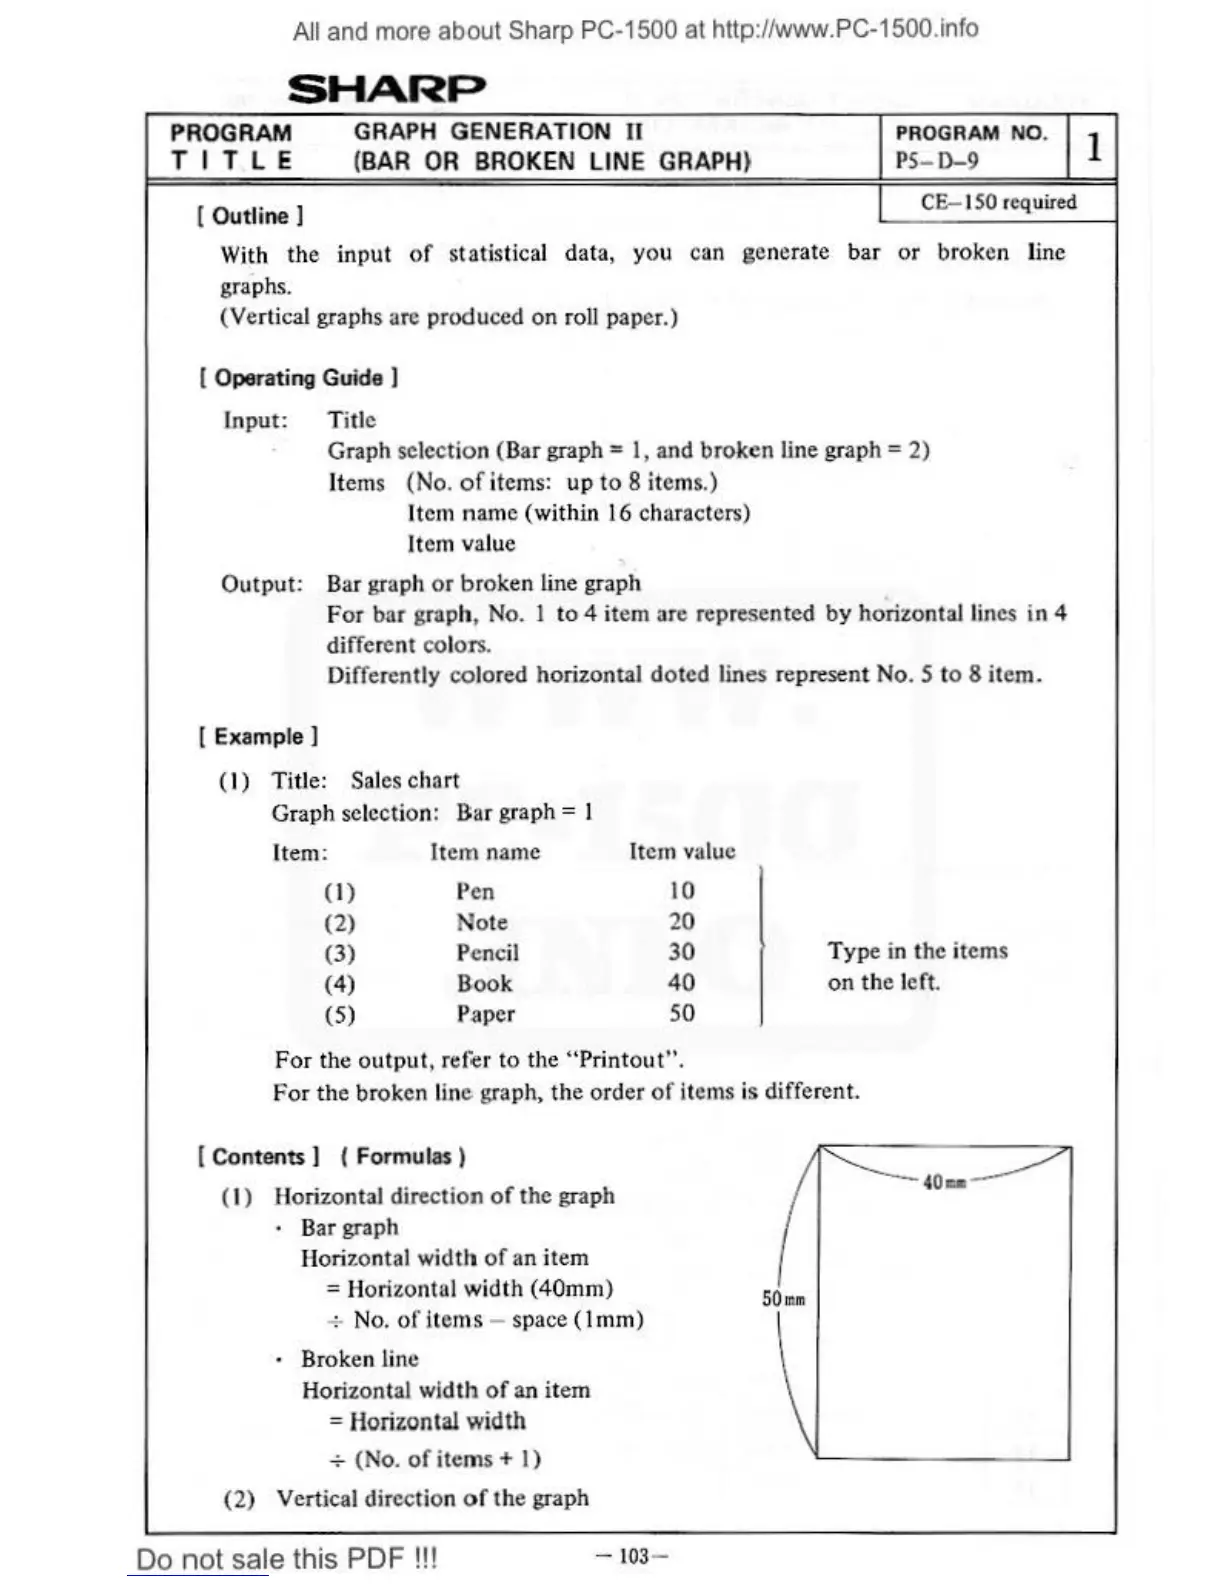
With
the
input
of
statisti
ca
l data,
you
can generate
bar
or
broken line
graphs.
(Vertical graphs are produced on roll
pap
er.)
I Operating Guide l
Input
: Title
Graph sele
ct
ion (Bar graph = I,
and
broken
line
graph=
2)
Items (No.
of
items:
up
to
8
it
ems.)
Item name (wi
th
in 16 characters)
Item value
Output
: Bar graph
or
bro
ken line graph
F
or
bar graph, No. I
to
4 item are represented by horizontal lines in 4
different
co
lors.
Differently colored horizontal d
oted
lines represent No. 5 to 8 item.
[
Example]
( I ) Title: Sales cha rt
Graph
se
le
ction:
Bar
graph = I
Item:
Item
na
me
(I)
Pen
(2)
Note
(3)
P
enc
il
(4) Book
(5)
Paper
Item
v:tluc
10
20
30
40
50
For
th
e
output
, refer
to
the
"Prin
t
out".
Typ
e in the items
on
the
left.
For
the broken line graph,
the
order
of
ite
ms
is different.
[ Contents ] ( Formulas )
( 1) Horiz
ont
al direc
tion
of
the
graph
·
Bar graph
Horizontal width
of
an
item
=H
orizontal wid
th
(40mm)
+ No.
of
items - space (1 mm)
· Broken line
Horizontal
wi
dth
of
an
item
= Horizontal
width
+ (No.
of
ite
m
s+
I)
(2)
Vertical direction
of
th
e graph
Do
not
sale this PDF !!!
-103
-
I
I