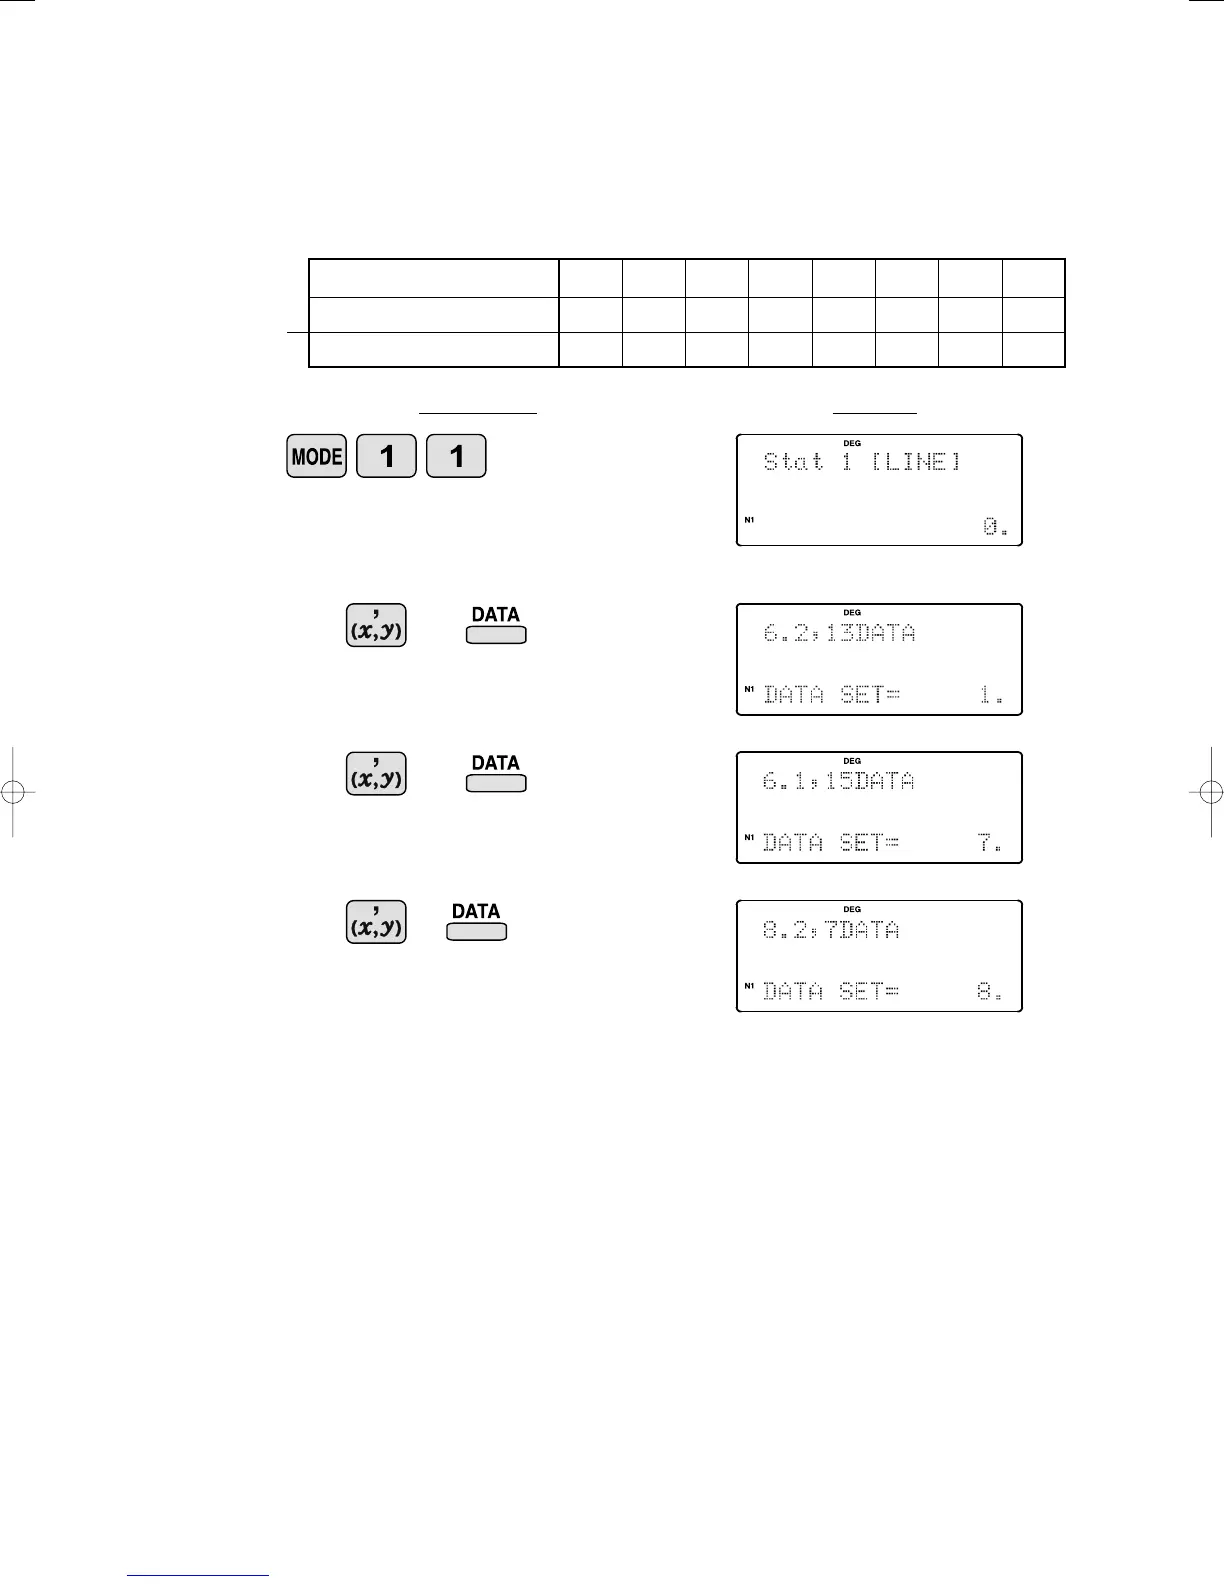
EasyManuals Logo
Home>Sharp>Calculator>WriteView EL-W531

Sharp WriteView EL-W531 User Manual

Sharp WriteView EL-W531
35 pages
To Next Page IconTo Next Page
To Previous Page IconTo Previous Page
Page #33 background imageLoading...
Page #33 background image
32
<Example 3>
Data table 3
Operation Display
6.2 13
6.1 15
8.2 7
The table below summarizes the dates in April when cherry
blossoms bloom, and the average temperature for March in
that same area. Determine basic statistical quantities for
data X and data Y based on the data table.
Select dual-variable statistics mode and linear regression calculation in sub-mode.
1998 1999 2000 2001 2002 2003 2004 2005
6.2 7.0 6.8 8.7 7.9 6.5 6.1 8.2
13 9 11 5 7 12 15 7
Year
x Average temperature
y Date blossoms bloom
.
.
.
GuideBookEL-W53107.2.52:48PMページ32
SHARPSHARP
© Sharp Corporation

Other manuals for Sharp WriteView EL-W531

Questions and Answers:

Question and Answer IconNeed help?

Do you have a question about the Sharp WriteView EL-W531 and is the answer not in the manual?

Sharp WriteView EL-W531 Specifications

General IconGeneral
BrandSharp
ModelWriteView EL-W531
CategoryCalculator
LanguageEnglish

Related product manuals