-20-
• The target glucose range is not related to the glucose alarm settings.
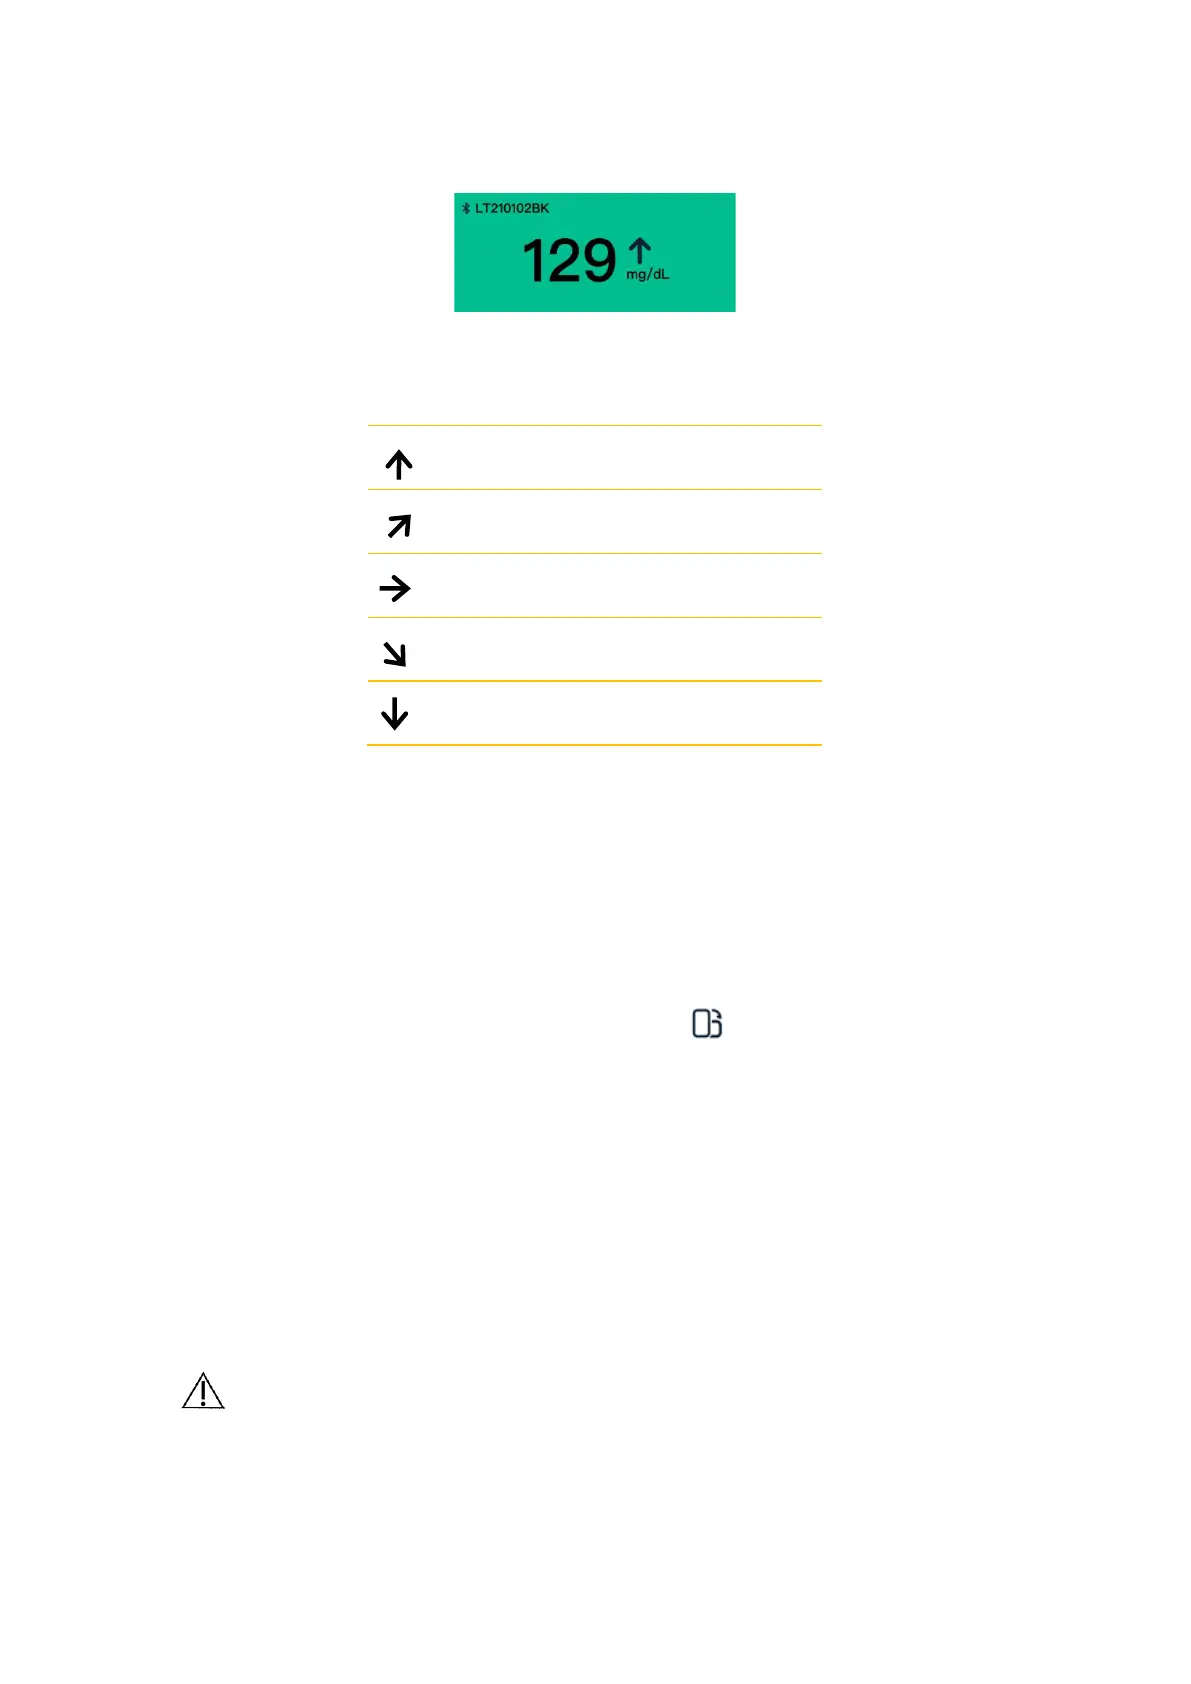
Trend arrows show the speed and direction of the glucose trends based on recent GS1
readings.
The sensor glucose graphs display the sensor readings in a 4-hour interval over the past
24 hours. The graphs include:
Glucose data from the Sensor over the past 3 to 24 hours displayed as a trend line,
ending with the most current glucose reading on the far right.
◼ Tap the graph at any glucose data point to highlight the associated value.
◼ Switch between a 3-hour, a 6-hour, a 12-hour and a 24-hour view of the glucose
data by tapping on the desired view duration above the graph.
◼ View the graphs in full screen by tapping below the graph.
Added notes appear as graphic symbols at the recorded time for each event. Tap
any symbol to display detailed information about the event.
Glucose Alarm
Glucose alarms are notifications from the App when glucose levels fall out of the set
alarm range.
To set or turn on glucose alarms, tap Profile > Setting Alarms. Select the
alarm you want to turn on and set.
CAUTION
Make sure your display device is always within 6 meters (20 feet)
around you and turn on alarms. You might not hear alarms if you are
outside of range.
 Loading...