PA100W RF Power Amplifier
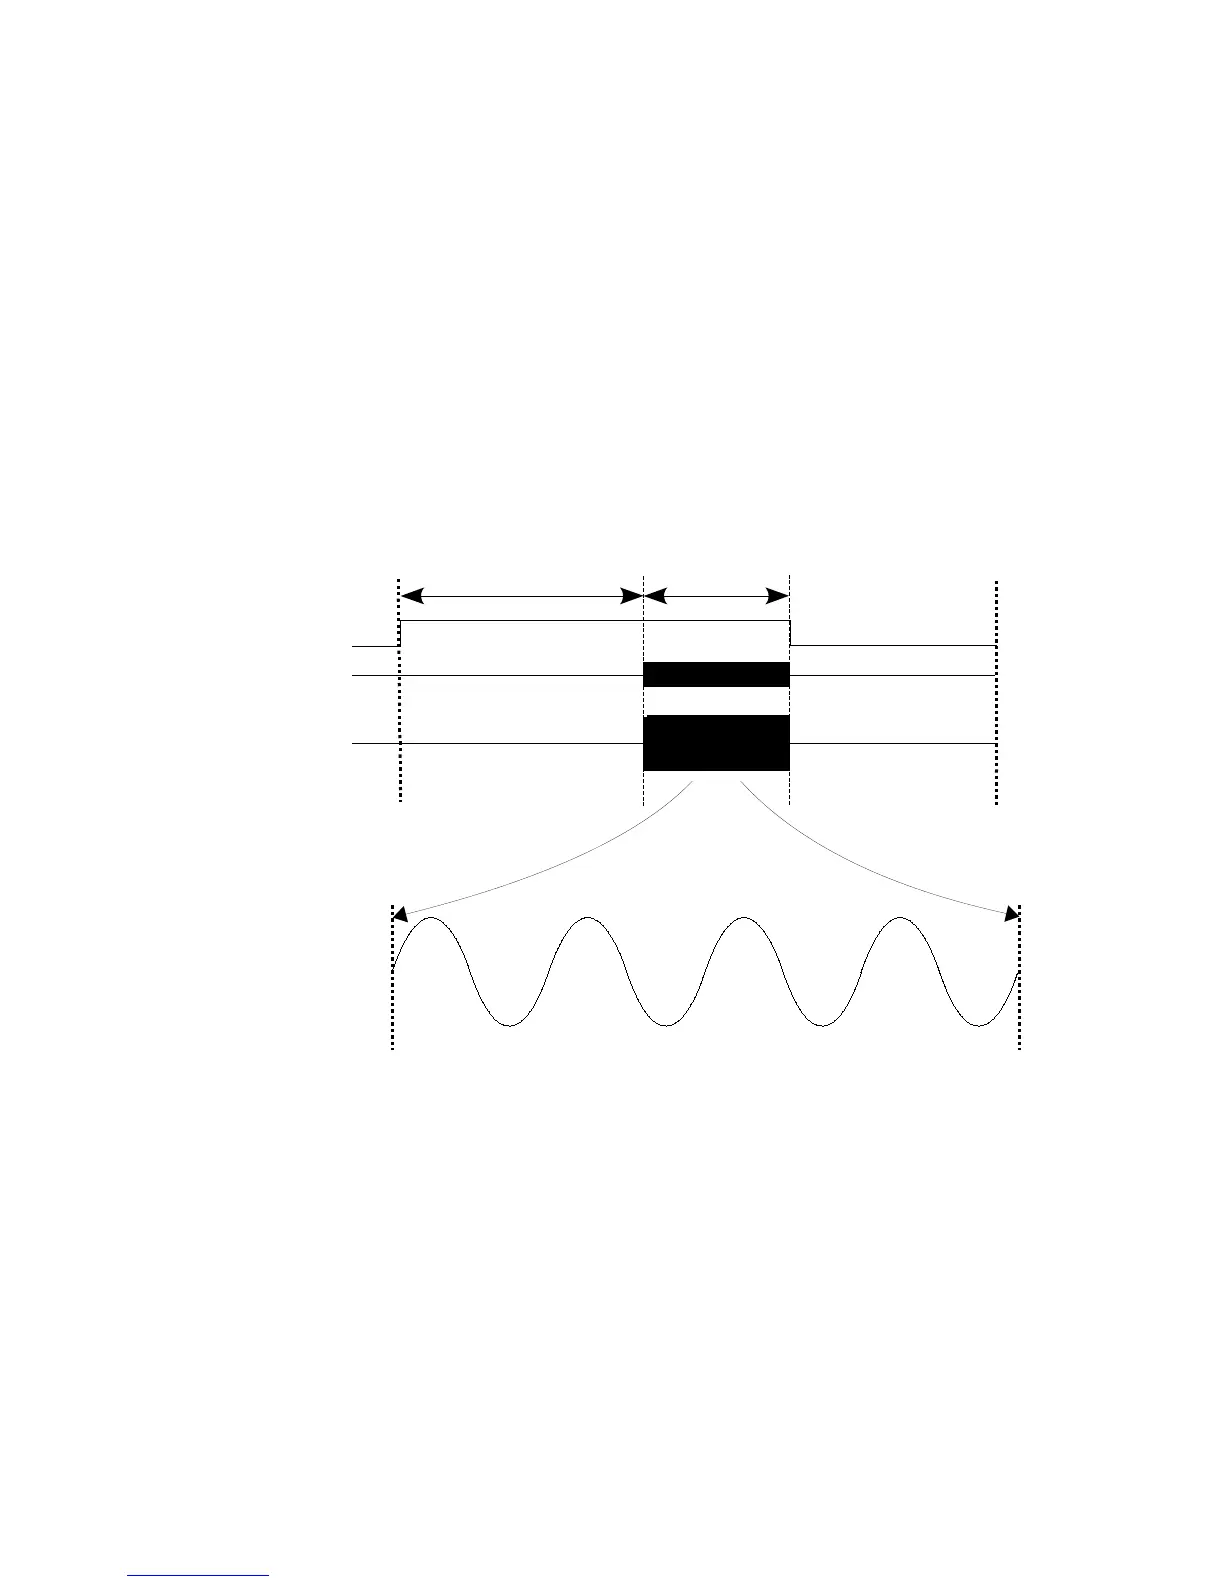
The timing diagram of a typical application of PA100W with the deblanking pulse applied prior to
the RF pulse is presented in Figure 4, below. The top trace is the deblanking signal, the trace
below represents the input signal, and the bottom trace is the RF output. In the lower panel, an
expanded view of the RF output pulse is depicted. At lower operating frequencies the output will be
progressively less sinusoidal. At these frequencies a filter will have to be used to obtain a sinusoidal
output. When working with short RF pulses, on the order of 1 us or so, triggering the oscilloscope
on the falling edge of the deblanking pulse will help with identifying and capturing the RF pulse on
the scope.
Figure 4: Representation of the deblanking and RF input and output signals to the PA100W.
http://www.spincore.com 9 2012-09-21
Deblanking
Signal
RF Output
Deblanking Delay
Pulse Time
RF Input