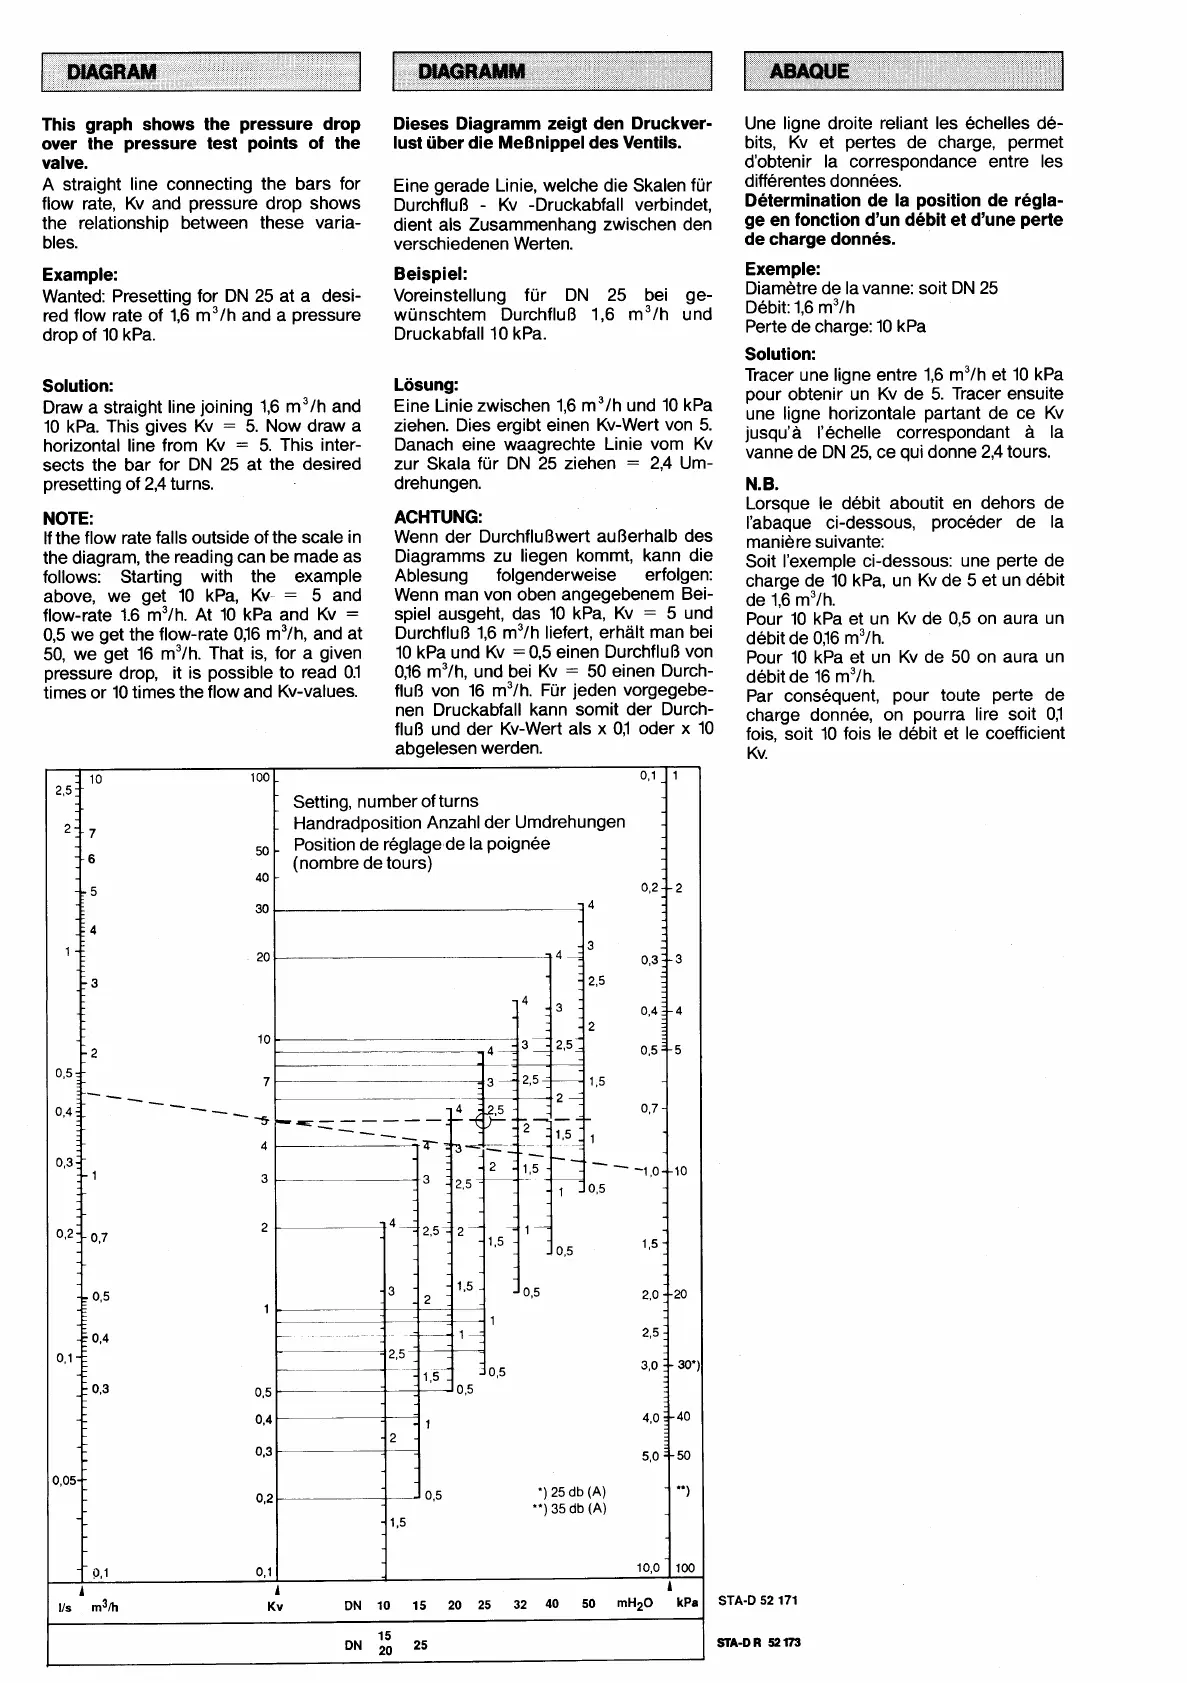
This graph shows the pressure drop
over the pressure test points of the
valve.
A straight line connecting the bars for
flow rate, Kv and pressure drop shows
the relationship between these varia-
bles.
Example:
Wanted: Presetting for DN 25 at a desi-
red flow rate of 1,6 m3/h and a pressure
drop of 10 kPa.
Solution:
Draw a straight line joining 1,6 m3/h and
10 kPa. This gives Kv
=
5. Now draw a
horizontal line from Kv
=
5. This inter-
sects the bar for DN 25 at the desired
presetting of 2,4 turns.
NOTE:
If the flow rate falls outside of the scale in
the diagram, the reading can be made as
follows: Starting with the example
above, we get 10 kPa, Kv
=
5 and
flow-rate 1.6 m3/h. At 10 kPa and Kv
=
0,5 we get the flow-rate OJ6 m3/h, and at
50, we get 16 m3/h. That is, for a given
pressure drop, it is possible to read 0.1
times or 10 times the flow and Kv-values.
Dieses Diagramm zeigt den Druckver-
lust uber die MeBnippel des Ventils.
Eine gerade Linie, welche die Skalen fur
DurchfluB
-
Kv -Druckabfall verbindet,
dient als Zusammenhang zwischen den
verschiedenen Werten.
Beispiel:
Voreinstellung fur DN 25 bei ge-
wunschtem DurchfluB 1,6 m3/h und
Druckabfall 10 kPa.
Lösung:
Eine Linie zwischen 1,6 m3/h und 10 kPa
ziehen. Dies ergibt einen Kv-Wert von 5.
Danach eine waagrechte Linie vom Kv
zur Skala fur DN 25 ziehen
=
2,4 Um-
drehungen.
ACHTUNG:
Wenn der Durchflu Bwert au Berhalb des
Diagramms zu liegen kommt, kann die
Ablesung folgenderweise erfolgen:
Wenn man von oben angegebenem Bei-
spiel ausgeht, das 10 kPa, Kv
=
5 und
DurchfluB 1,6 m3/h liefert, erhalt man bei
10 kPa und Kv
=
0,5 einen DurchfluB von
OJ6 m3/h, und bei Kv
=
50 einen Durch-
fluB von 16 m3/h. Fur jeden vorgegebe-
nen Druckabfall kann somit der Durch-
fluB und der Kv-Wert als x 0,l oder x 10
abgelesen werden.
100
-
-
Setting, number of turns
-
Handradposition Anzahl der Umdrehungen
50
Position de reglagede la poignee
(nombre de tours)
40
-
Une ligne droite reliant les echelles de-
bits, Kv et pertes de charge, permet
d'obtenir la correspondance entre les
differentes donnees.
Determination de la position de regla-
ge en fonction d'un debit et d'une perte
de charge donnes.
Exemple:
Diametre de lavanne: soit DN 25
Debit: 1,6 m3/h
Perte de charge: 10 kPa
Solution:
Tracer une ligne entre 1,6 m3/h et 10 kPa
pour obtenir un Kv de 5. Tracer ensuite
une ligne horizontale partant de ce Kv
jusqu'a I'echelle correspondant a la
vanne de DN 25, ce qui donne 2,4 tours.
N. B.
Lorsque le debit aboutit en dehors de
I'abaque ci-dessous, proceder de la
maniere suivante:
Soit I'exemple ci-dessous: une perte de
charge de 10 kPa, un Kv de 5 et un debit
de 1,6 m3/h.
Pour 10
kPa et un Kv de 0,5 on aura un
debit de OJ6 m3/h.
Pour 10
kPa et un Kv de 50 on aura un
debit de 16 m3/h.
Par consequent, pour toute perte de
charge donnee, on
pourra lire soit 0,l
fois, soit 10 fois le debit et le coefficient
Kv.
STA-D
52
171
STA-D
R
P
173
 Loading...