Technology Tip: The TI-82 remembers the window it displayed before a zoom. So, if you should zoom in
too much and lose the curve, press ZOOM 1 [ZPrevious] to go back to the window before. If you want
to execute a series of zooms but then return to a particular window, press ZOOM 2 [ZoomSto] to store
the current window’s dimensions. Later, press ZOOM 3 [ZoomRcl] to recall the stored window.
I.2.7 Value: Graph in the standard viewing window (Figure I.12). The TI-82 can calculate
the value of this function for any given (between the Xmin and Xmax values).
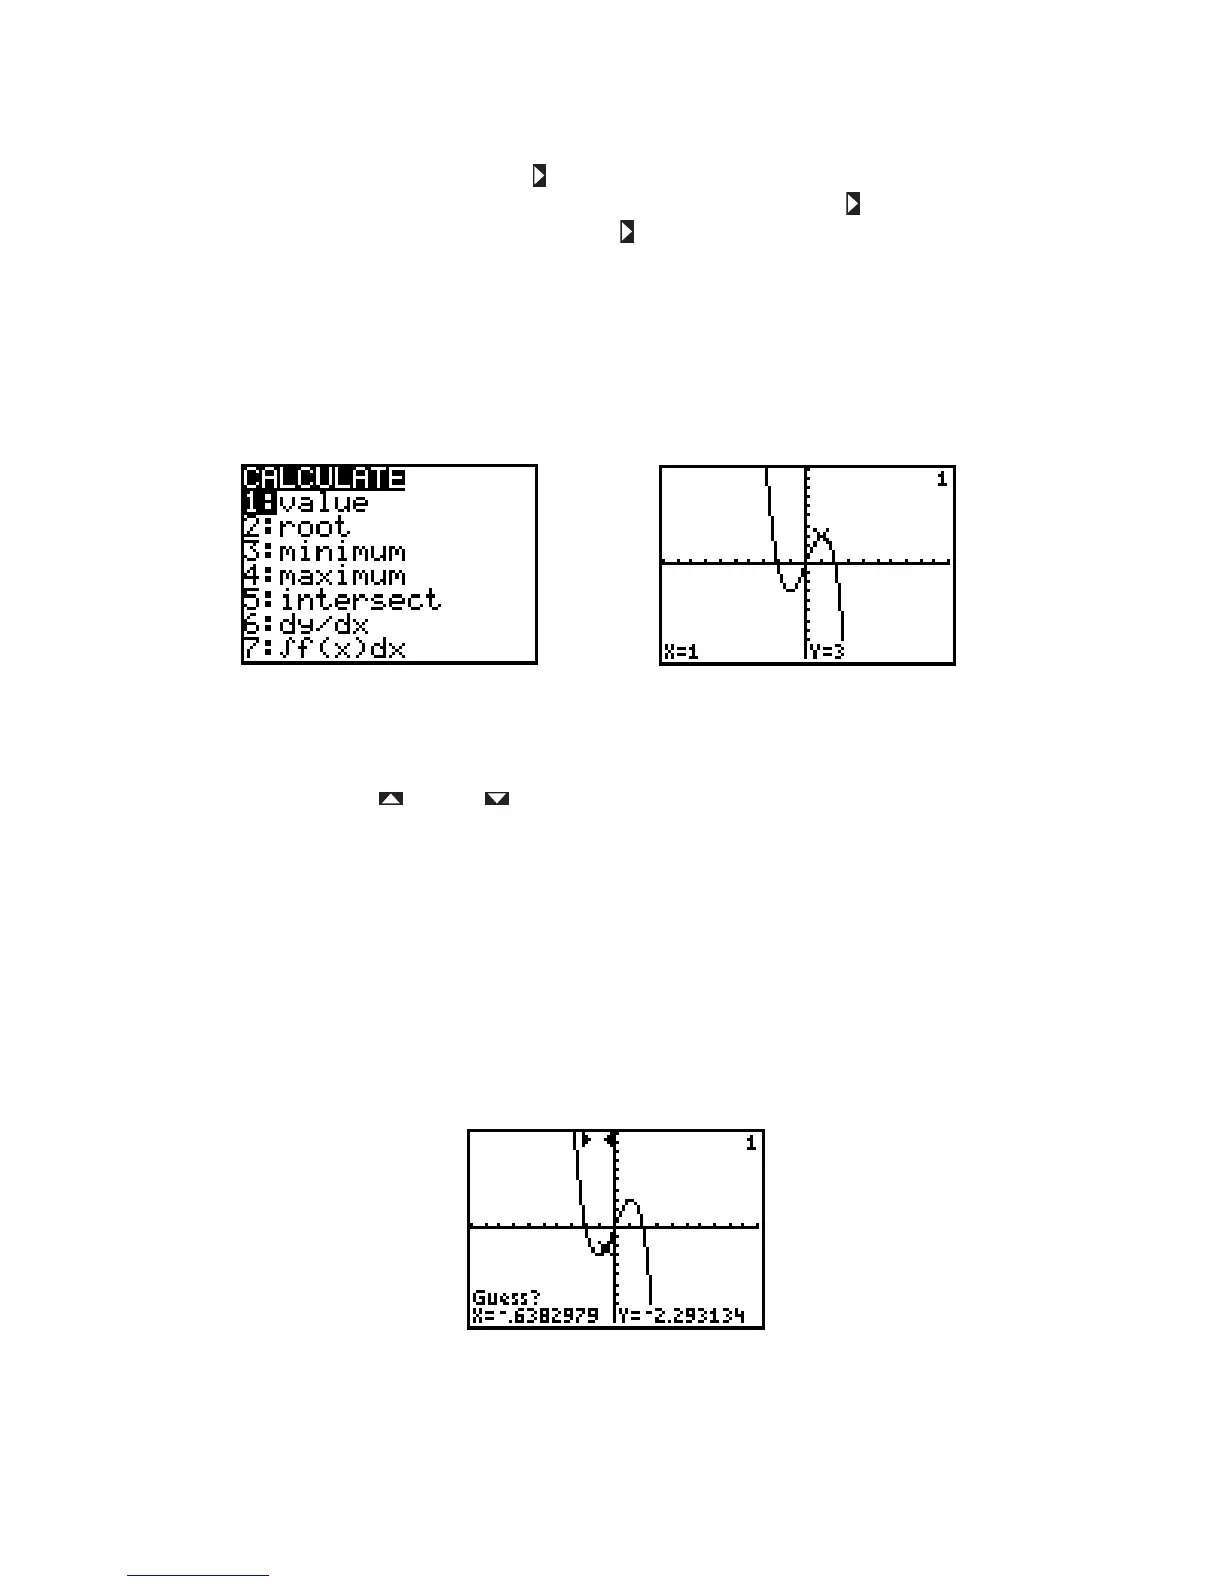
Press 2nd CALC to display the CALCULATE menu (see Figure I.45), then press 1 [value]. The graph of
the function is displayed and you are prompted to enter a value for Press 1 ENTER. The value you
entered and its corresponding value are shown at the bottom of the screen and the cursor is located at the
point on the graph (see Figure I.46).
Figure I.45: CALCULATE menu Figure I.46: Finding a value
Note that if you have more than one graph on the screen, the upper right corner of the TI-82 screen will
display the numeral corresponding to the equation of the function in the Y= list whose value is being
calculated. Press the up or down arrow key to move the cursor vertically between functions at the
entered value.
I.2.8 Relative Minimums and Maximums: Graph once again in the standard viewing win-
dow (Figure I.12). This function appears to have a relative minimum near and a relative maximum
near 1. You may zoom and trace to approximate these extreme values.
First trace along the curve near the relative minimum. Notice by how much the values and values change
as you move from point to point. Trace along the curve until the coordinate is as small as you can get it,
so that you are as close as possible to the relative minimum, and zoom in (press ZOOM 2 ENTER or use a
zoom box). Now trace again along the curve and, as you move from point to point, see that the coordinates
change by smaller amounts than before. Keep zooming and tracing until you find the coordinates of the
relative minimum point as accurately as you need them, approximately
Figure I.47: Finding a minimum

 Loading...


