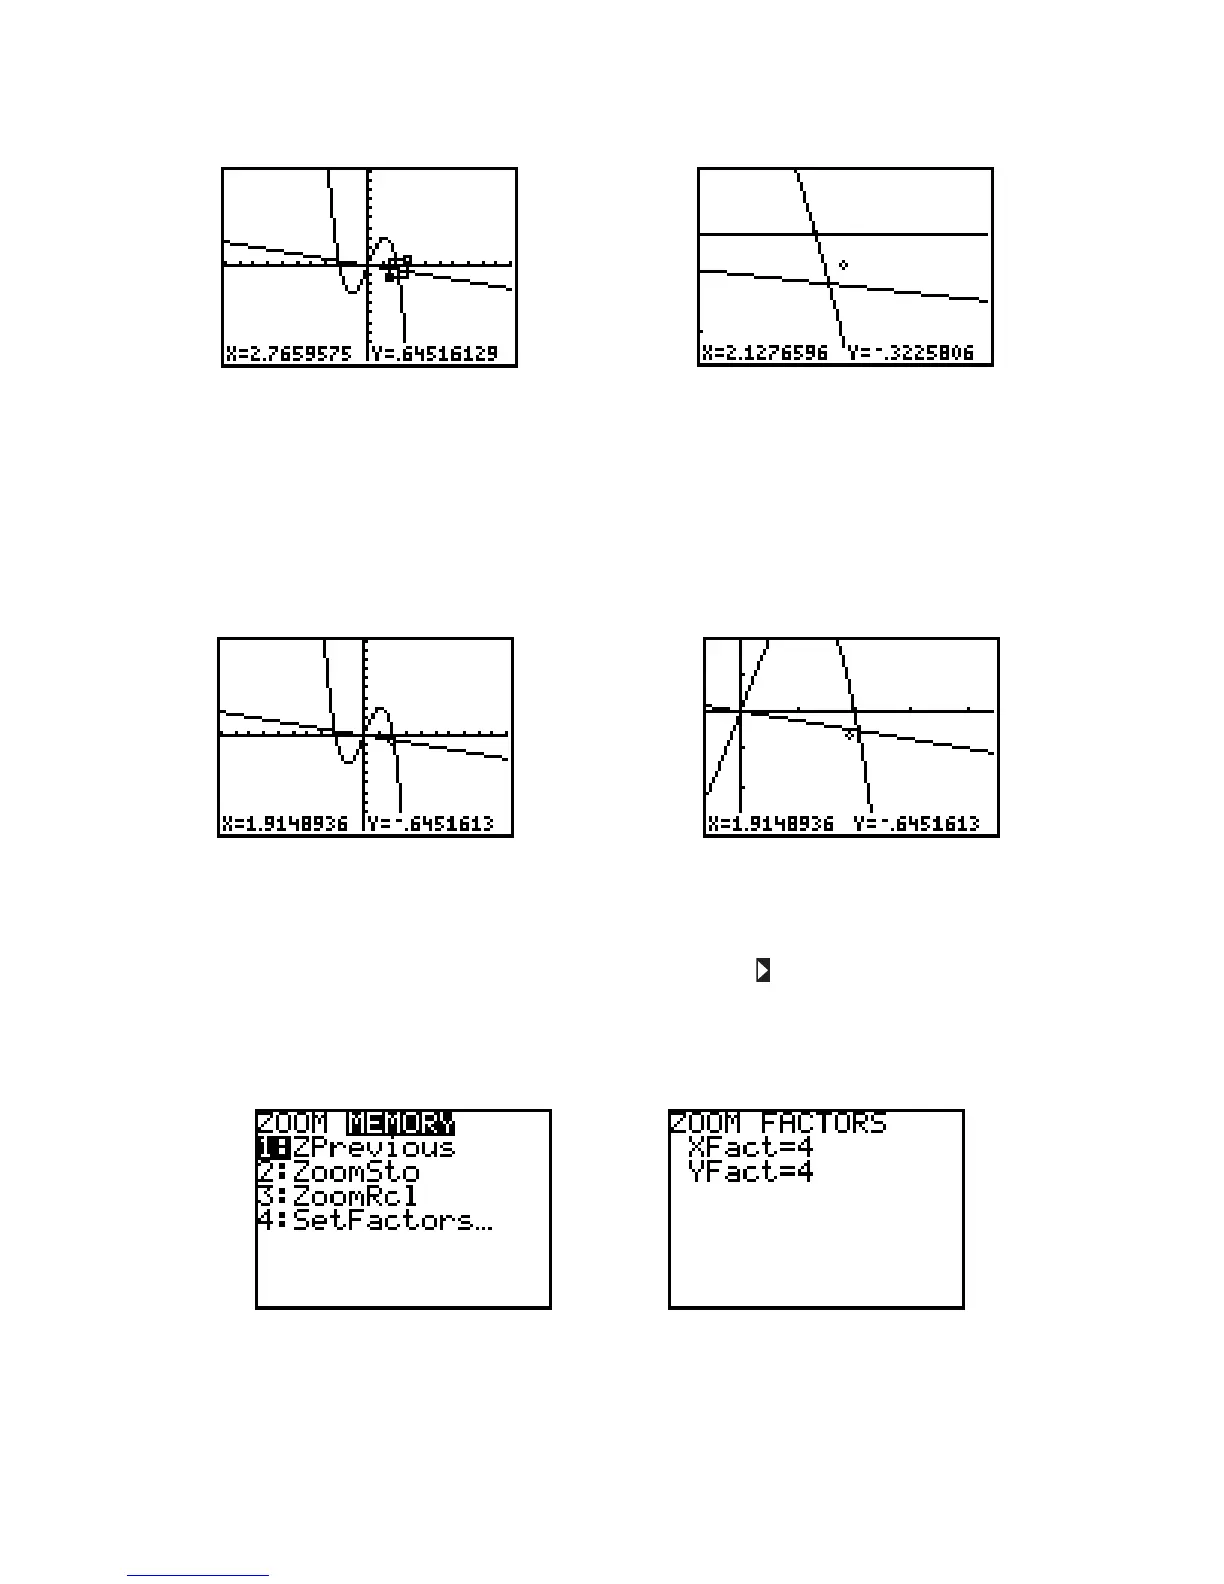
Figure I.39: Box drawn Figure I.40: New viewing window
You can also quickly magnify a graph around the cursor’s location. Return once more to the standard viewing
window for the graph of the two functions and Press ZOOM 2 [Zoom In] and
then press arrow keys to move the cursor as close as you can to the point of intersection near (see
Figure I.41). Then press ENTER and the calculator draws a magnified graph, centered at the cursor’s
position (Figure I.42). The range variables are changed to reflect this new viewing window. Look in the
WINDOW menu to verify this.
Figure I.41: Before a zoom in Figure I.42: After a zoom in
As you see in the ZOOM menu (Figure I.37), the TI-82 can Zoom In (press ZOOM 2) or Zoom Out (press
ZOOM 3). Zoom out to see a larger view of the graph, centered at the cursor position. You can change
the horizontal and vertical scale of the magnification by pressing ZOOM 4 [SetFactors...] (see figure I.43)
and editing XFact and YFact, the horizontal and vertical magnification factors (see Figure I.44).
The default zoom factor is 4 in both directions. It is not necessary for XFact and YFact to be equal.
Sometimes, you may prefer to zoom in one direction only, so the other factor should be set to 1. As usual,
press 2nd QUIT to leave the ZOOM menu.
Figure I.43: ZOOM MEMORY menu Figure I.44: ZOOM MEMORY SetFactors...

 Loading...


