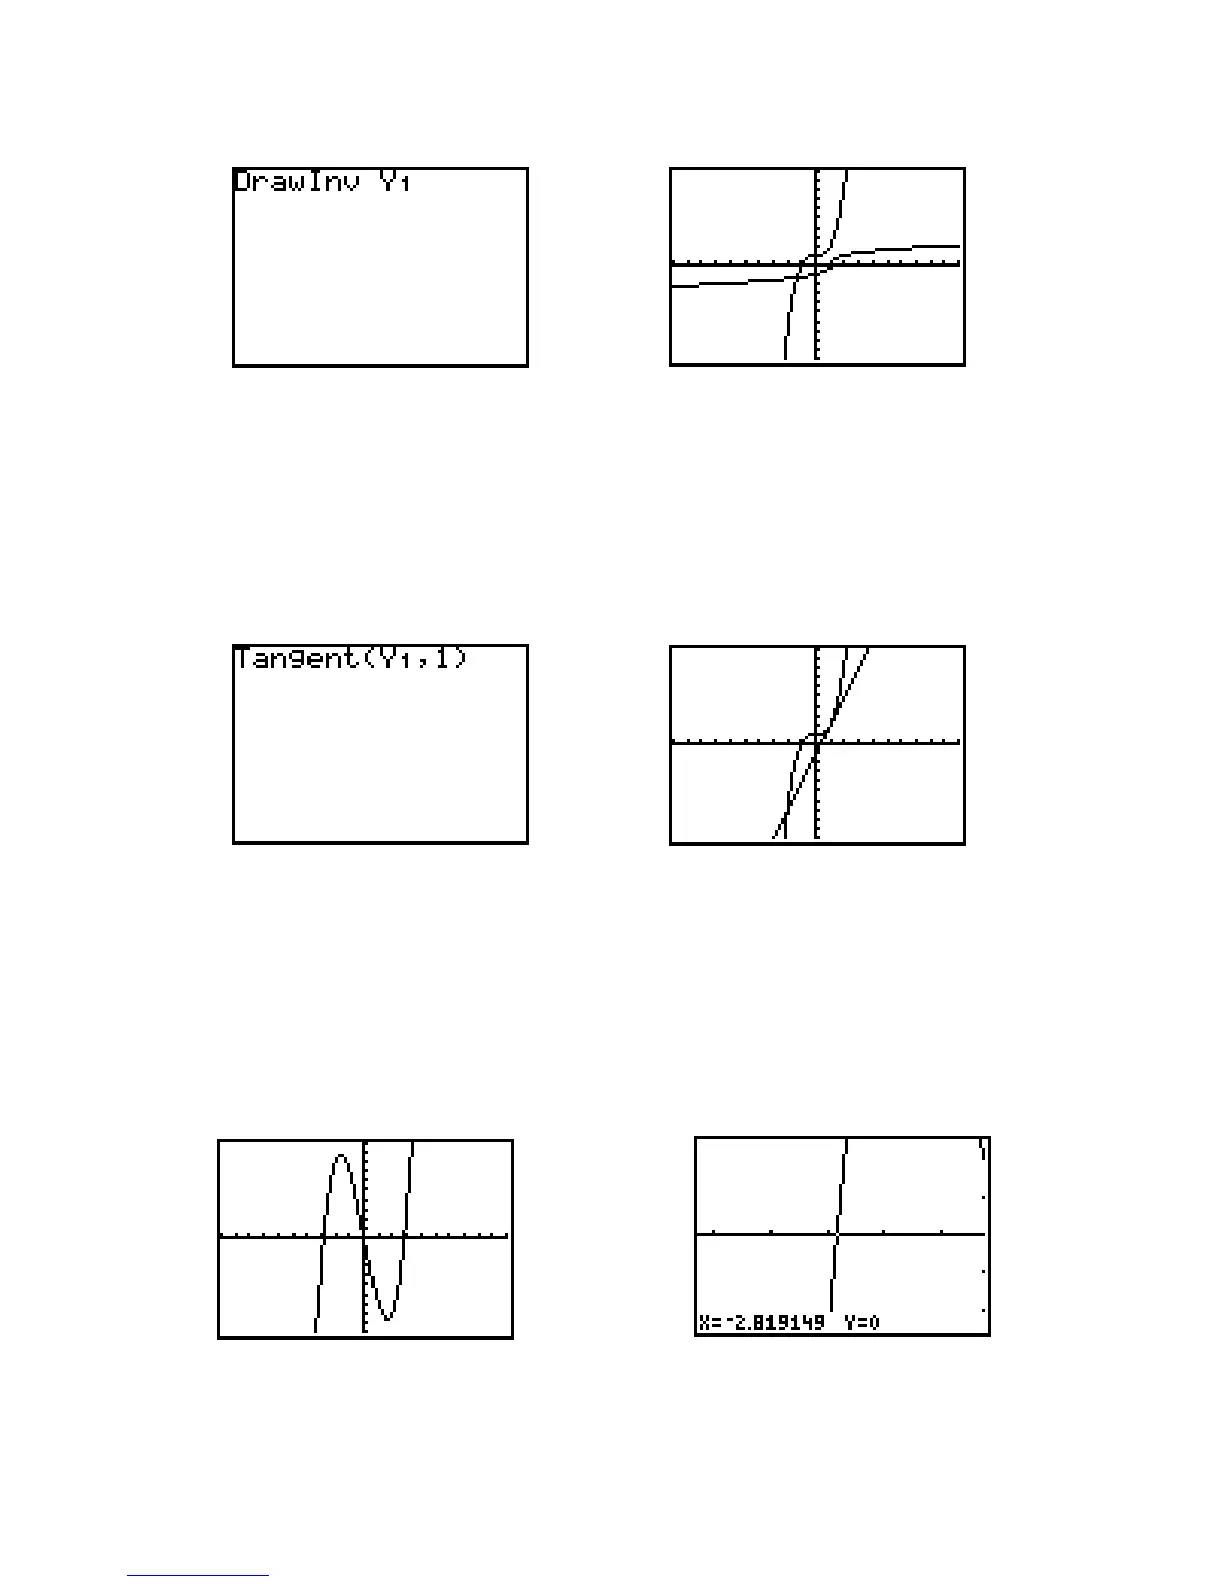
Figure I.51: DrawInv Figure I.52: Graph of and its inverse function
I.2.10 Tangent Lines: Once again, graph in the standard viewing window (see Figure I.49). The
TI-82 can draw the tangent line to a graph of a function at a specified point.
While on the home screen, press 2nd DRAW 5 [Tangent(] 2nd Y-VARS 1 1 , 1 ) ENTER (see Figure I.53).
These keystrokes instruct the TI-82 to draw the tangent line to the graph of at 1. The graph of the
original function and the tangent line to the graph at will be displayed (see Figure I.54).
To clear the tangent line, press 2nd DRAW 1.
Figure I.53: Tangent Figure I.54: Graph of and tangent line at
I.3 Solving Equations and Inequalities
I.3.1 Intercepts and Intersections: Tracing and zooming are also used to locate an intercept of a graph,
where a curve crosses the axis. For example, the graph of crosses the axis three times (see
Figure I.55). After tracing over to the intercept point that is farthest to the left, zoom in (Figure I.56).
Continue this process until you have located all three intercepts with as much accuracy as you need. The
three intercepts of are approximately 0, and 2.828.
Figure I.55: Graph of Figure I.56: Near an intercept of y x
3
8xx-y x
3
8x

 Loading...


