Technology Tip: As you zoom in, you may also wish to change the spacing between tick marks on the axis
so that the viewing window shows scale marks near the intercept point. Then the accuracy of your
approximation will be such that the error is less than the distance between two tick marks. Change the scale
on the TI-82 from the WINDOW menu. Move the cursor down to Xscl and enter an appropriate value.
The intercept of a function’s graph is a root of the equation So press 2nd CALC to display the
CALCULATE menu (Figure I.45) and choose 2 [root] to find a root of this function. Set a lower bound,
upper bound, and guess as described in Section I.2.8. The TI-82 shows the coordinates of the point and
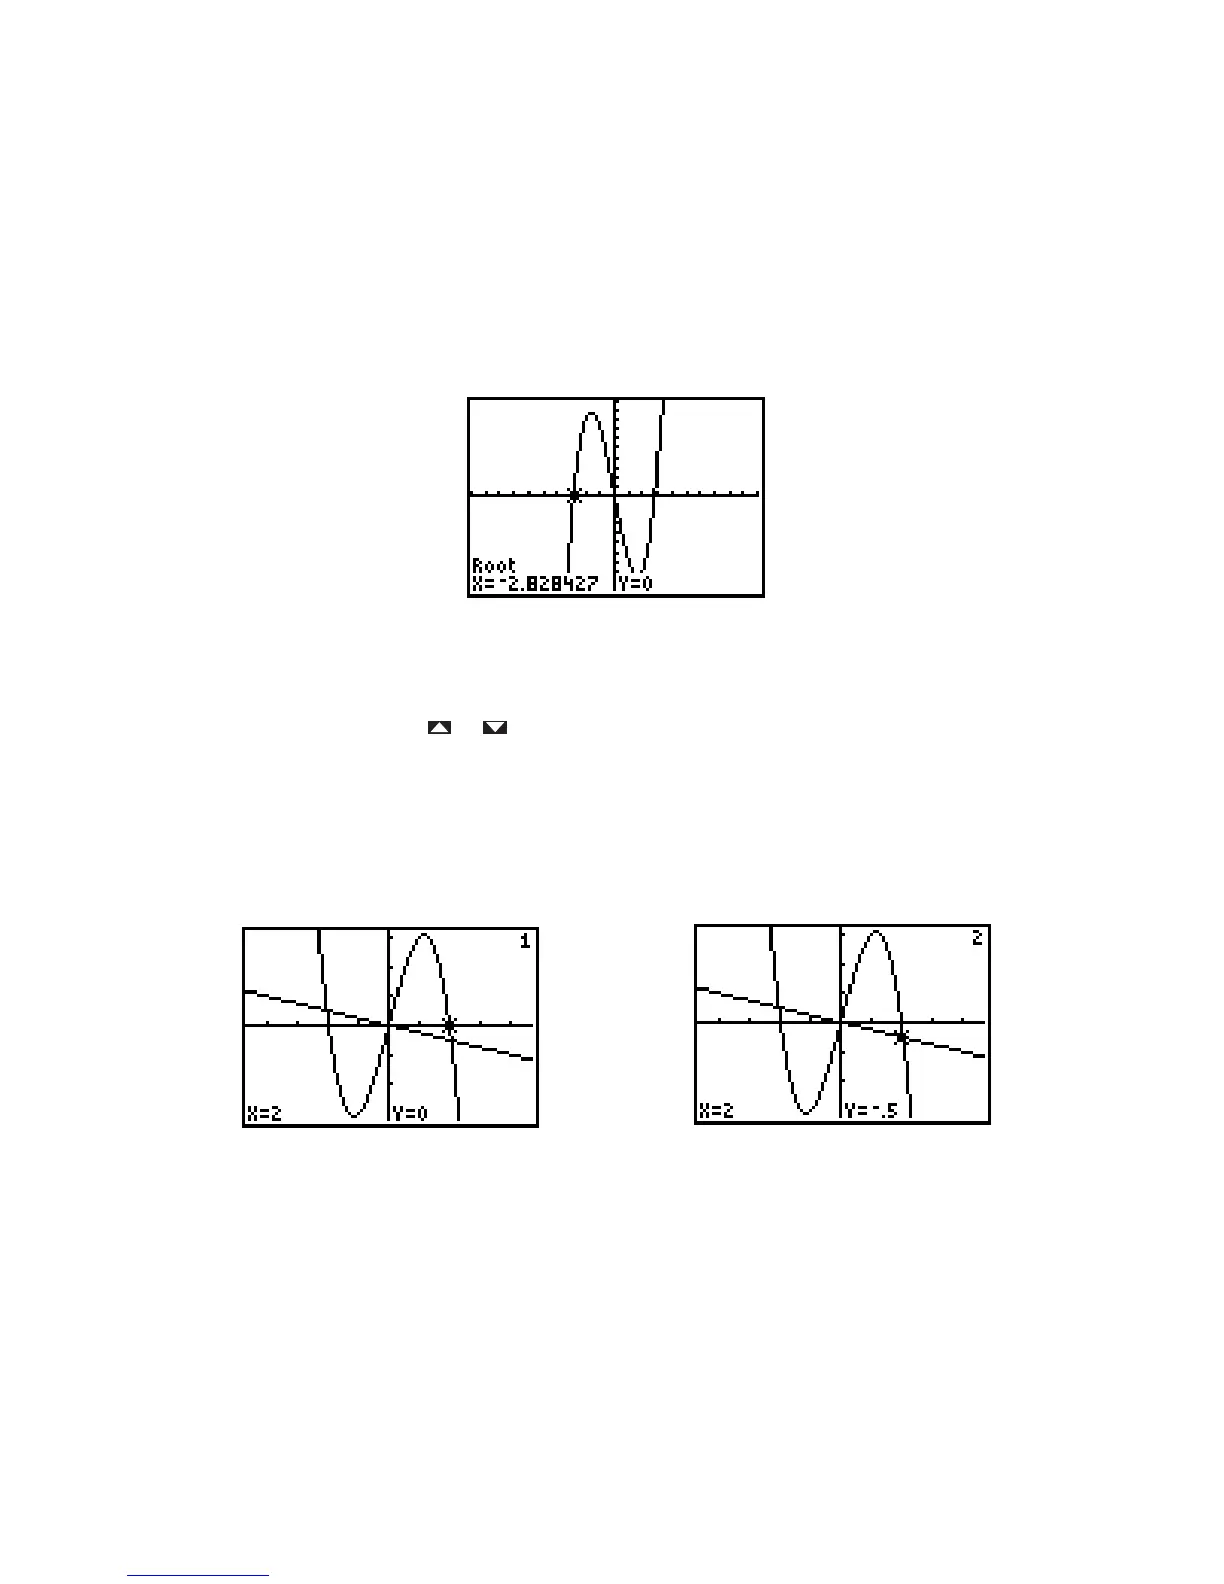
indicates that it is a root (Figure I.57).
Figure I.57: A root of
TRACE and ZOOM are especially important for locating the intersection points of two graphs, say the
graphs of and Trace along one of the graphs until you arrive close to an
intersection point. Then press or to jump to the other graph. Notice that the coordinate does not
change, but the coordinate is likely to be different (see Figures I.58 and I.59).
When the two coordinates are as close as they can get, you have come as close as you now can to the point
of intersection. so zoom in around the intersection point, then trace again until the two coordinates are as
close as possible. Continue this process until you have located the point of intersection with as much accu-
racy as necessary. The points of intersection are approximately and
Figure I.58: Trace on Figure I.59: Trace on
You can also find the point of intersection of two graphs by pressing 2nd CALC 5 [intersect]. Trace with
the cursor first along one graph near the intersection and press ENTER; then trace with the cursor along the
other graph and press ENTER. Marks are placed on the graphs at these points. Finally, move the cursor
near the point of intersection and press ENTER again. Coordinates of the intersection will be displayed at
the bottom of the window. More will said about the intersect feature in Section I.3.3.
y .25xy x
3
4x

 Loading...


