14
G
RAPHING
T
ECHNOLOGY
G
UIDE
: TI-82
Copyright © Houghton Mifflin Company. All rights reserved.
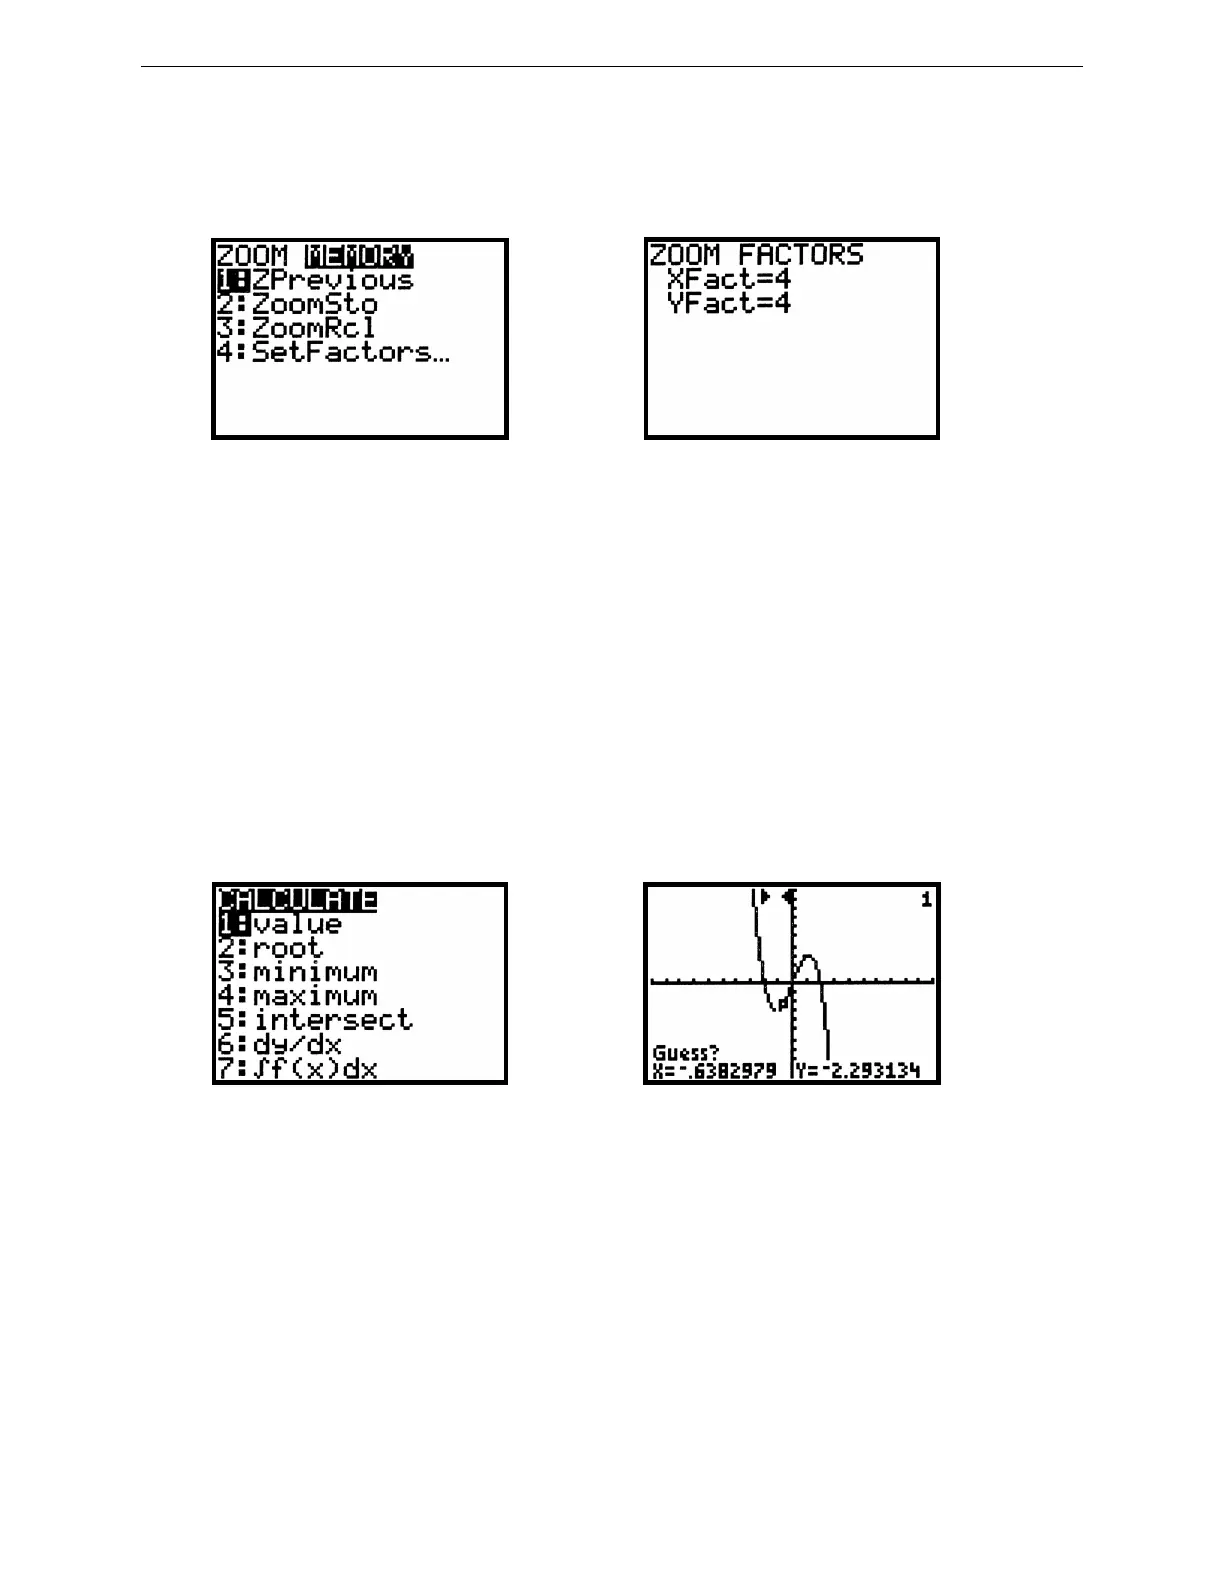
The default zoom factor is 4 in both directions. It is not necessary for XFact and YFact to be equal. Sometimes, you
may prefer to zoom in one direction only, so the other factor should be set to 1. As usual, press 2nd QUIT to leave
the ZOOM menu.
Figure 2.40: ZOOM MEMORY menu Figure 2.41: ZOOM MEMORY SetFactors...
Technology Tip: The TI-82 remembers the window it displayed before a zoom. So if you should zoom in too much
and lose the curve, press ZOOM ►
1 to go back to the window before. If you want to execute a series of zooms but
then return to a particular window, press ZOOM ►
2 to store the current window’s dimensions. Later, press ZOOM
►
3 to recall the stored window.
2.2.7 Relative Minimums and Maximums: Graph y = –x
3
+ 4x once again in the standard viewing rectangle (Figure
2.12). This function appears to have a relative minimum near x = –1 and a relative maximum near x = 1. You may
zoom and trace to approximate these extreme values.
First trace along the curve near the local minimum. Notice by how much the x-values and y-values change as you
move from point to point. Trace along the curve until the y-coordinate is as small as you can get it, so that you are as
close as possible to the local minimum, and zoom in (press ZOOM 2 or use a zoom box). Now trace again along the
curve and, as you move from point to point, see that the coordinates change by smaller amounts than before. Keep
zooming and tracing until you find the coordinates of the local minimum point as accurately as you need them,
approximately (–1.15, –3.08).
Figure 2.42: CALCULATE menu Figure 2.43: Finding a minimum
Follow a similar procedure to find the relative maximum. Trace along the curve until the y-coordinate is as great as
you can get it, so that you are as close as possible to the relative maximum, and zoom in. The local maximum point
on the graph of y = –x
3
+ 4x is approximately (1.15, 3.08).
 Loading...


