15
G
RAPHING
T
ECHNOLOGY
G
UIDE
: TI-82
Copyright © Houghton Mifflin Company. All rights reserved.
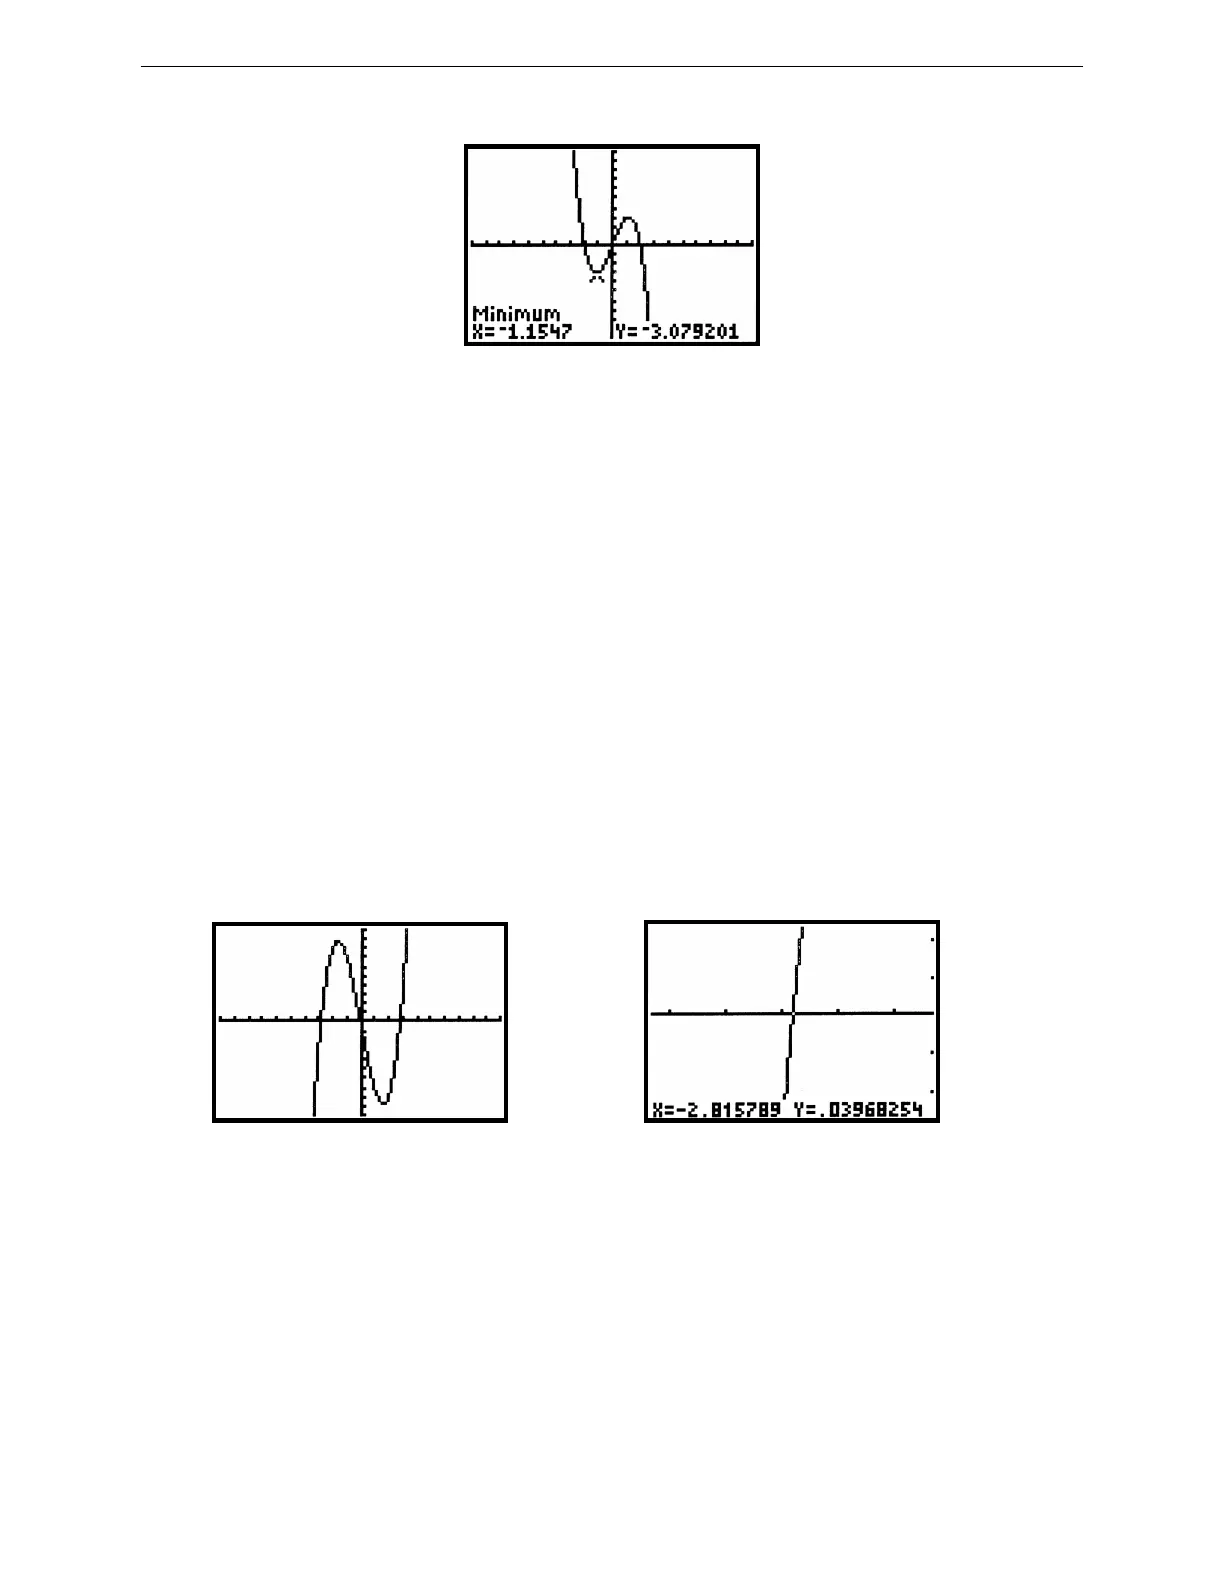
Figure 2.44: Relative minimum on y = –x
3
+
4x
The TI-82 automates the search for relative minimum and relative maximum points. Press 2nd CALC to display the
CALCULATE menu (Figure 2.42). Choose 3 to calculate the minimum value of the function and 4 for the
maximum. You will be prompted to trace the cursor along the graph first to a point left of the minimum/maximum
(press ENTER to set this lower bound). Then move to a point right of the minimum/maximum and set an upper
bound (as in Figure 2.43) and press ENTER. Note the two arrows marking the lower and upper bounds at the top of
the display.
Next move the cursor along the graph between the two bounds and as close to the minimum/maximum as you can;
this serves as a guess for the TI-82 to start its search. Good choices for the lower bound, upper bound, and guess can
help the calculator work more efficiently and quickly. Press ENTER and the coordinates of the relative
minimum/maximum point will be displayed (see Figure 2.44).
2.3 Solving Equations and Inequalities
2.3.1 Intercepts and Intersections: Tracing and zooming are also used to locate an x-intercept of a graph, where a
curve crosses the x-axis. For example, the graph of y = x
3
– 8x crosses the x-axis three times (see Figure 2.45). After
tracing over to the x-intercept point that is furthest to the left, zoom in (Figure 2.46). Continue this process until you
have located all three intercepts with as much accuracy as you need. The three x-intercepts of y = x
3
– 8x are
approximately –2.828, 0, and 2.828.
Figure 2.45: Graph of y = x
3
–8x Figure 2.46: An x-intercept of y = x
3
– 8x
Technology Tip: As you zoom in, you may also wish to change the spacing between tick marks on the x-axis so that
the viewing rectangle shows scale marks near the intercept point. Then the accuracy of your approximation will be
such that the error is less than the distance between two tick marks. Change the x-scale on the TI-82 from the
WINDOW menu. Move the cursor down to Xscl and enter an appropriate value.
The x-intercept of a function’s graph is a root of the equation f (x) = 0. So press 2nd CALC to display the
CALCULATE menu (Figure 2.42) and choose 2 to find a root of this function. Set a lower bound, upper bound, and
guess as described above in Section 2.2.7.

 Loading...


