8
G
RAPHING
T
ECHNOLOGY
G
UIDE
: TI-82
Copyright © Houghton Mifflin Company. All rights reserved.
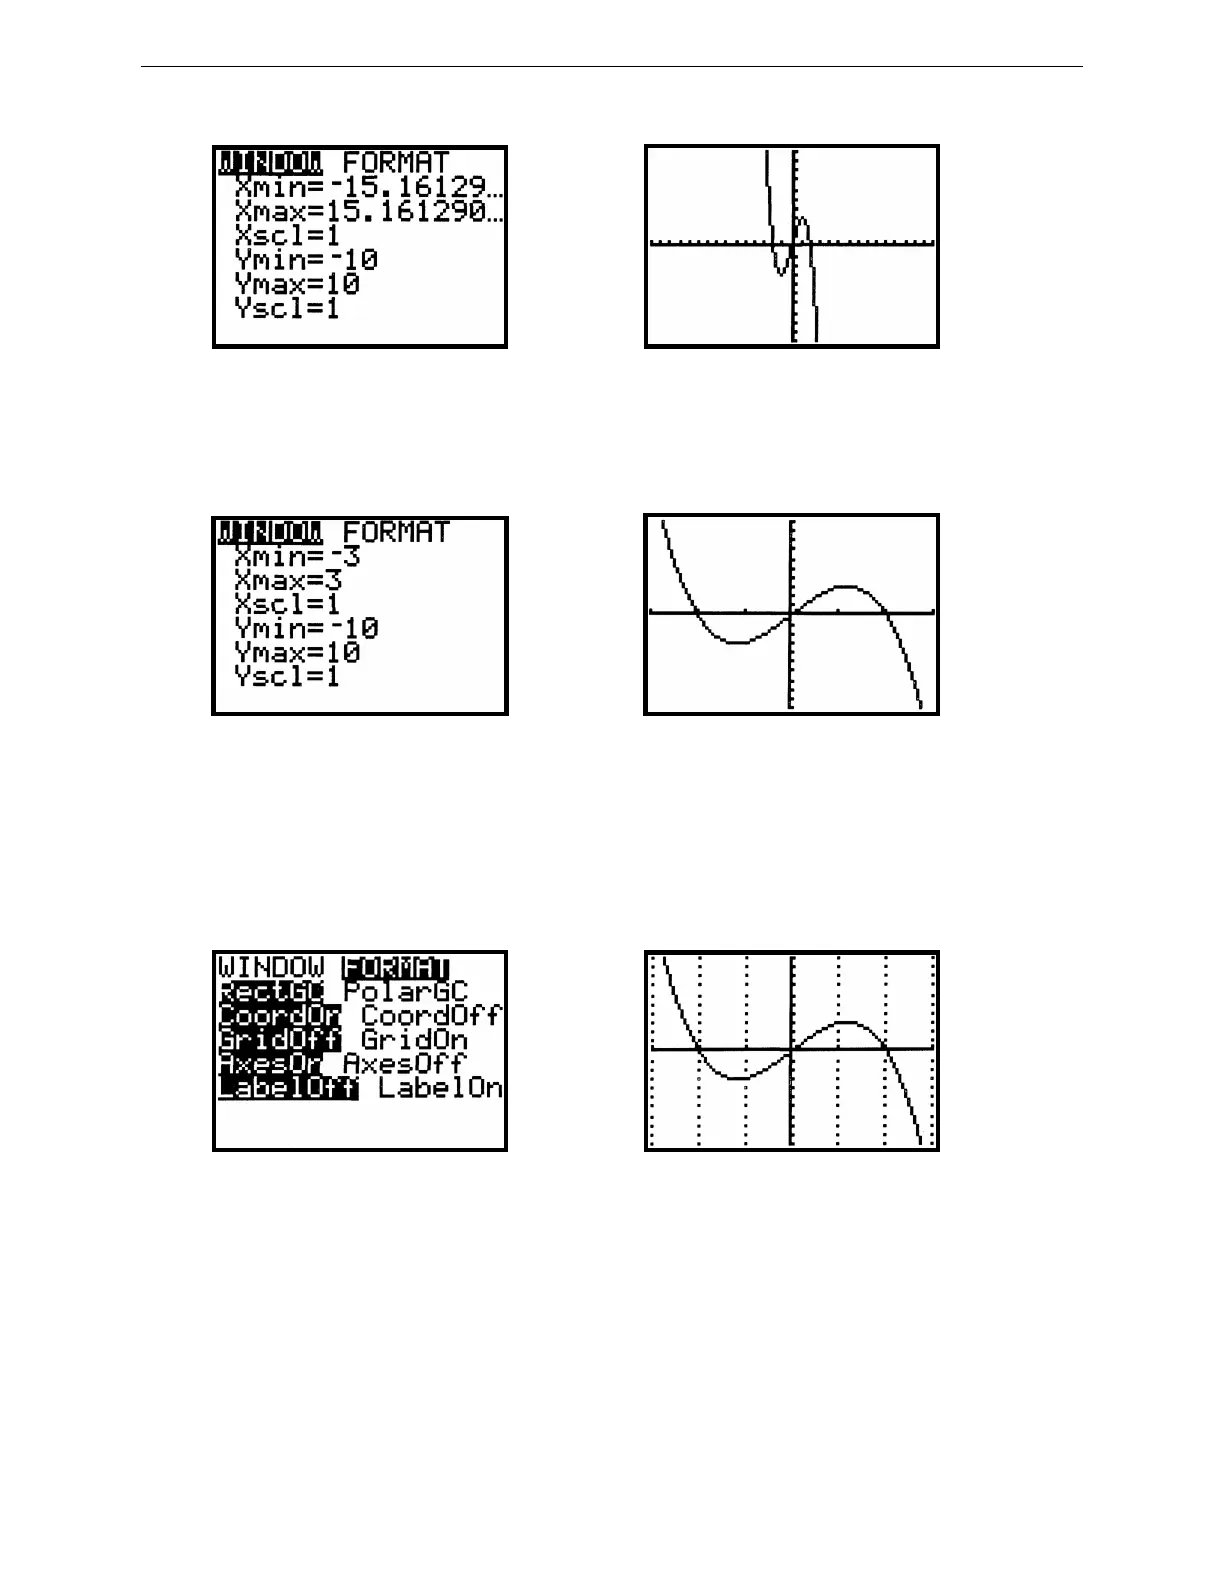
Figure 2.14: Square window Figure 2.15: Graph of y = –x
3
+ 4x
To set the range quickly to standard values (see Figure 2.13), press ZOOM 6. To set the viewing rectangle quickly
to a square (Figure 2.14), press ZOOM 5. More information about square windows is presented later in Section
2.2.4.
Figure 2.16: Custom window Figure 2.17: Graph of y = –x
3
+ 4x
Sometimes you may wish to display grid points corresponding to tick marks on the axes. This and other graph
format options may be changed by pressing WINDOW ► to display the FORMAT menu (Figure 2.18). Use arrow
keys to move the blinking cursor to GridOn; press ENTER and then GRAPH to redraw the graph. Figure 2.19
shows the same graph as in Figure 2.17 but with the grid turned on. In general, you’ll want the grid turned off, so do
that now by pressing WINDOW ►, use the arrow keys to move the blinking cursor to GridOff, and press ENTER
and CLEAR.
Figure 2.18: WINDOW FORMAT menu Figure 2.19: Grid turned on for y = –x
3
+ 4x
2.2.3 Piecewise-Defined Functions: The greatest integer function, written [[x]], gives the greatest integer less than
or equal to a number x. On the TI-82, the greatest integer function is called Int and is located under the NUM sub-
menu of the MATH menu (see Figure 2.5). So calculate [[6.78]] = 6 by pressing MATH ► 4 6.78 ENTER.
To graph y = [[x]], go in the Y= menu, move beside Y
1
and press CLEAR MATH ►
4
X,T,θ
GRAPH. Figure 2.20
shows this graph in a viewing rectangle from –5 to 5 in both directions.