9
G
RAPHING
T
ECHNOLOGY
G
UIDE
: TI-82
Copyright © Houghton Mifflin Company. All rights reserved.
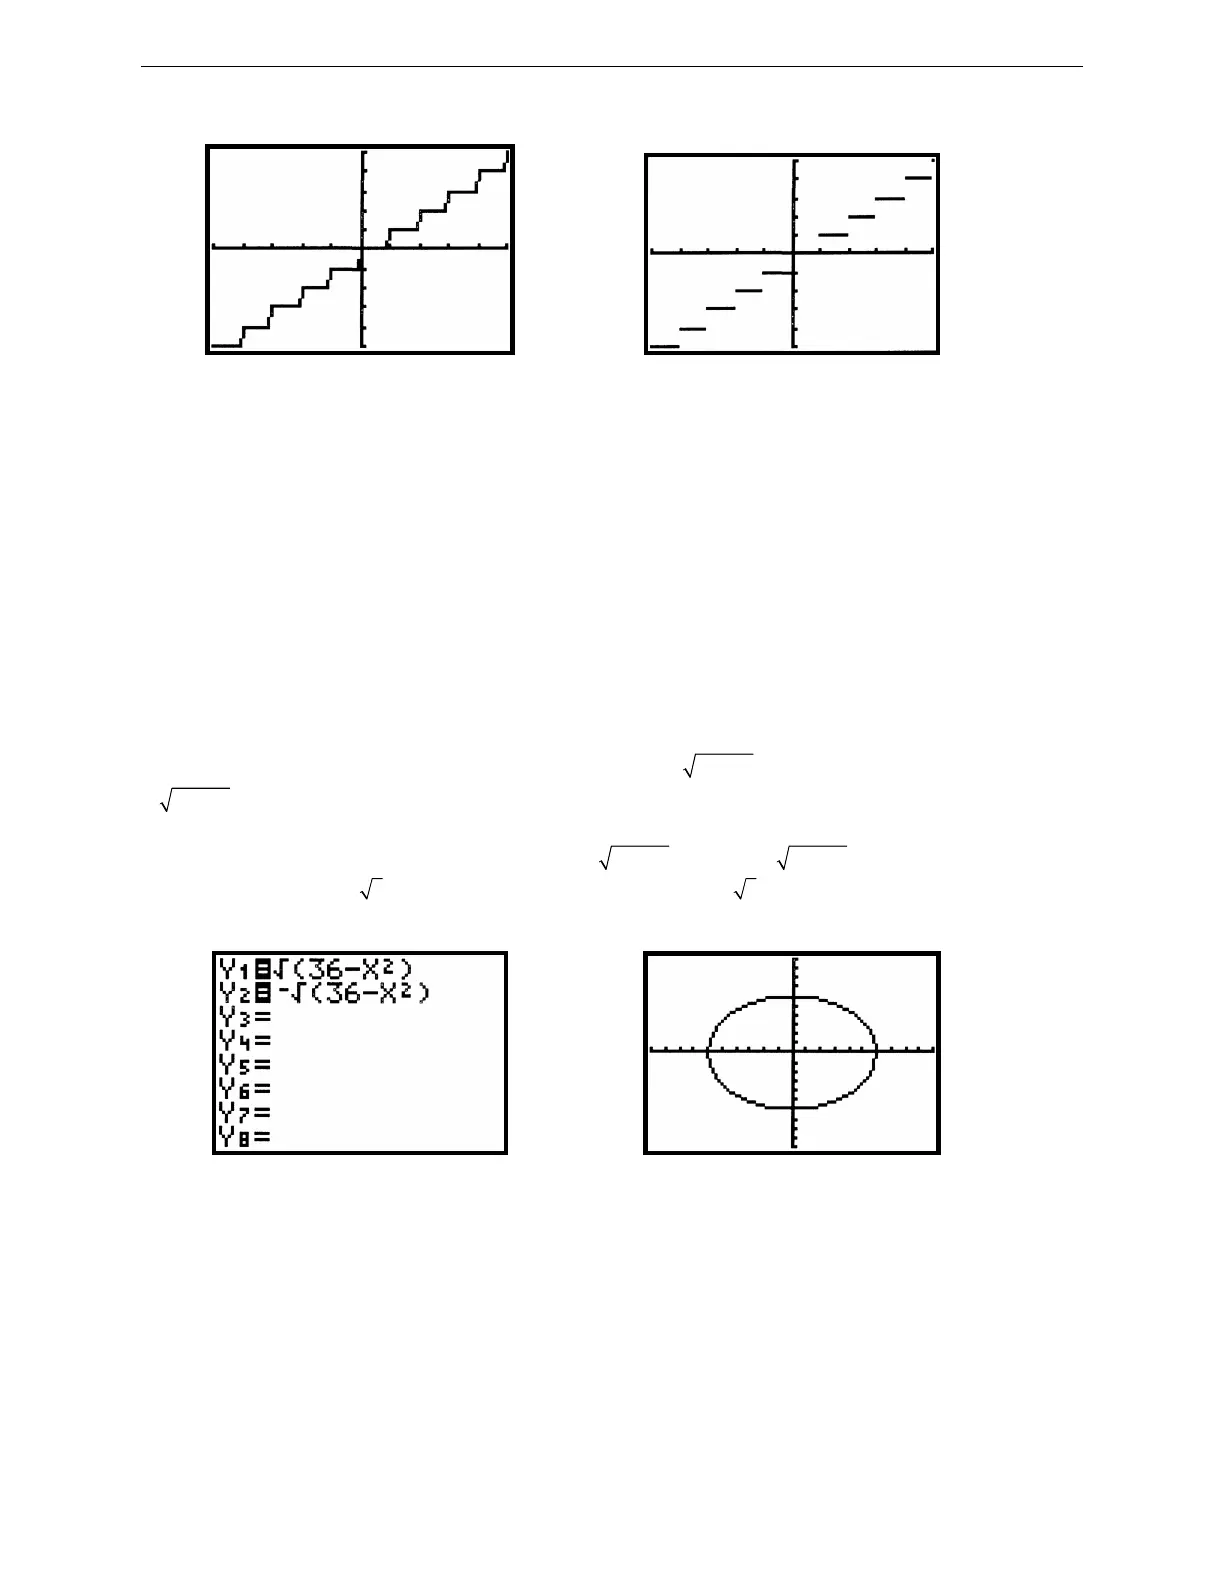
Figure 2.20: Connected graph of y = [[x]] Figure 2.21: Dot graph of y = [[x]]
The true graph of the greatest integer function is a step graph, like the one in Figure 2.21. For the graph of y = [[x]],
a segment should not be drawn between every pair of successive points. You can change from Connected line to
Dot graph on the TI-82 by opening the MODE menu. Move the cursor down to the fifth line; select whichever graph
type you require; press ENTER to put it into effect and GRAPH to see the result.
You should also change to Dot graph when plotting a piecewise-defined function. For example, to plot the graph of
f (x) =
2
1, 0
1, 0
xx
xx
+<
−≥
, enter the expression (x
2
+ 1)(x < 0) + (x – 1)(x ≥ 0) somewhere in your Y= list by pressing
(
X,T,θ
x
2
+ 1) (
X,T,θ
2nd TEST 5 0 ) + (
X,T,θ
– 1 ) (
X,T,θ
2nd TEST 4 0 ). Then change the mode to Dot graph
and press GRAPH.
2.2.4 Graphing a Circle: Here is a useful technique for graphs that are not functions, but that can be “split” into a
top part and a bottom part, or into multiple parts. Suppose you wish to graph the circle whose equation is x
2
+ y
2
=
36. First solve for y and get an equation for the top semicircle, y =
2
36 x−
,
and for the bottom semicircle, y =
2
36 x−−
.
Then graph the two semicircles simultaneously.
The keystrokes to draw this circle’s graph follow. Enter
2
36 x−
as Y
1
and
2
36 x−−
as Y
2
(see Figure 2.22) by
pressing Y= CLEAR 2nd
( 36 –
X,T,θ
x
2
) ENTER CLEAR (-) 2nd ( 36 –
X,T,θ
x
2
). Then press GRAPH
to draw them both.
Figure 2.22: Two semicircles Figure 2.23: Circle’s graph - standard view
If your range were set to the standard viewing rectangle, your graph would look like Figure 2.23. Now this does not
look like a circle, because the units along the axes are not the same. This is where the square viewing rectangle is
important. Press ZOOM 5 and see a graph that appears more circular.