10
G
RAPHING
T
ECHNOLOGY
G
UIDE
: TI-82
Copyright © Houghton Mifflin Company. All rights reserved.
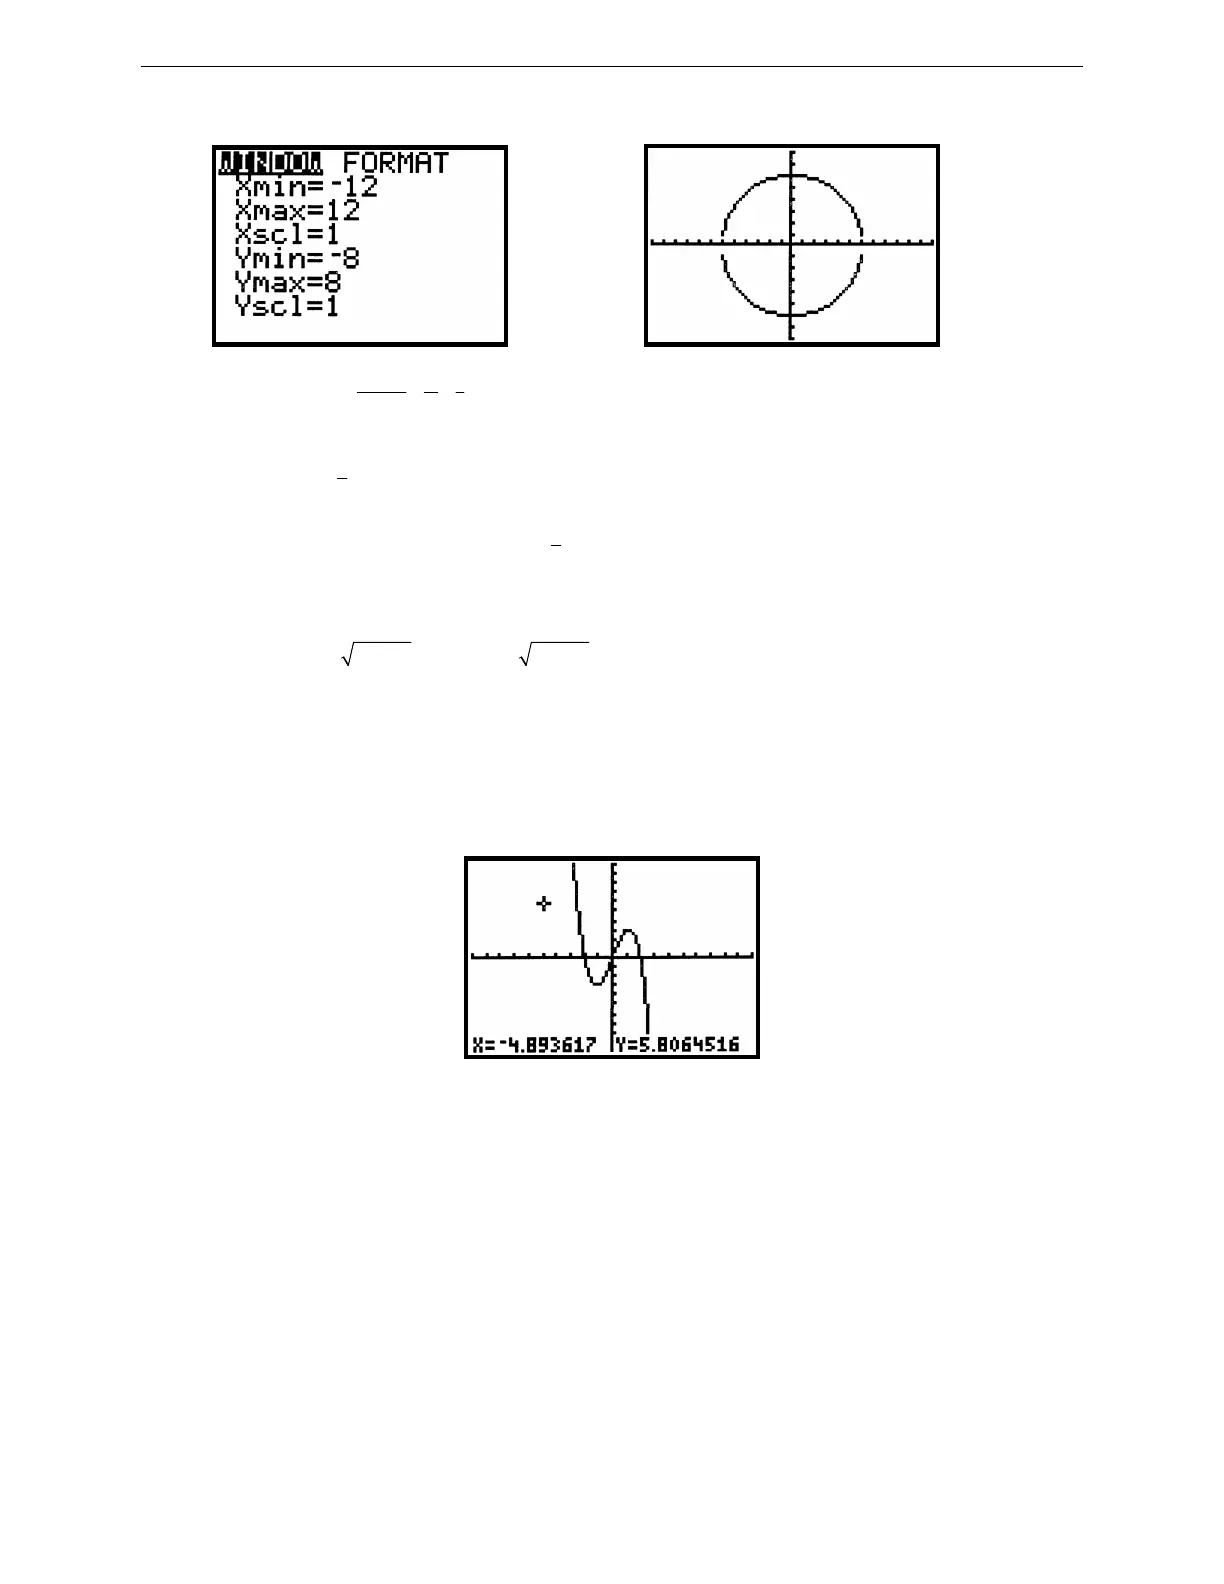
Figure 2.24:
vertical 16 2
horizontal 24 3
==
Figure 2.25: A “square” circle
Technology Tip: Another way to get a square graph is to change the range variables so that the value of Ymax –
Ymin is approximately
2
3
times Xmax – Xmin. For example, see the WINDOW in Figure 2.24 and the
corresponding graph in Figure 2.25. The method works because the dimensions of the TI-82’s display are such that
the ratio of vertical to horizontal is approximately
2
3
.
The two semicircles in Figure 2.25 do not meet because of an idiosyncrasy in the way the TI-82 plots a graph.
Back when you entered
2
36 x−
as Y
1
and
2
36 x−−
as Y
2
, you could have entered –Y
1
as Y
2
and saved some
keystrokes. Try this by going back to the Y= menu and pressing the arrow key to move the cursor down to Y
2
. Then
press CLEAR (-) 2nd Y-
VARS
1 1. The graph should be just as it was before.
2.2.5 TRACE. Graph y = –x
3
+ 4x in the standard viewing rectangle. Press any of the arrow keys ▲ ▼ ◄ ► and
see the cursor move from the center of the viewing rectangle. The coordinates of the cursor’s location are displayed
at the bottom of the screen, as in Figure 2.26, in floating decimal format. This cursor is called a free-moving cursor
because it can move from dot to dot anywhere in the graph window.
Figure 2.26: Free-moving cursor
Remove the free-moving cursor and its coordinates from the window by pressing GRAPH, CLEAR, or ENTER.
Press an arrow key again and the free-moving cursor will reappear at the same point you left it.
 Loading...


