©2007 Key Curriculum Press Discovering Algebra Calculator Notes for the Texas Instruments TI-83 and TI-83/84 Plus 19
TI-83 and TI-83/84 Plus
(continued)
Note 1H • Connecting the Points
The xyLine connects a sequence of points with line segments. The order in
which the points are connected is the order in which the coordinates appear in
the lists.
Enter data and set the window as described in Note 1F.
Displaying the Connected Points
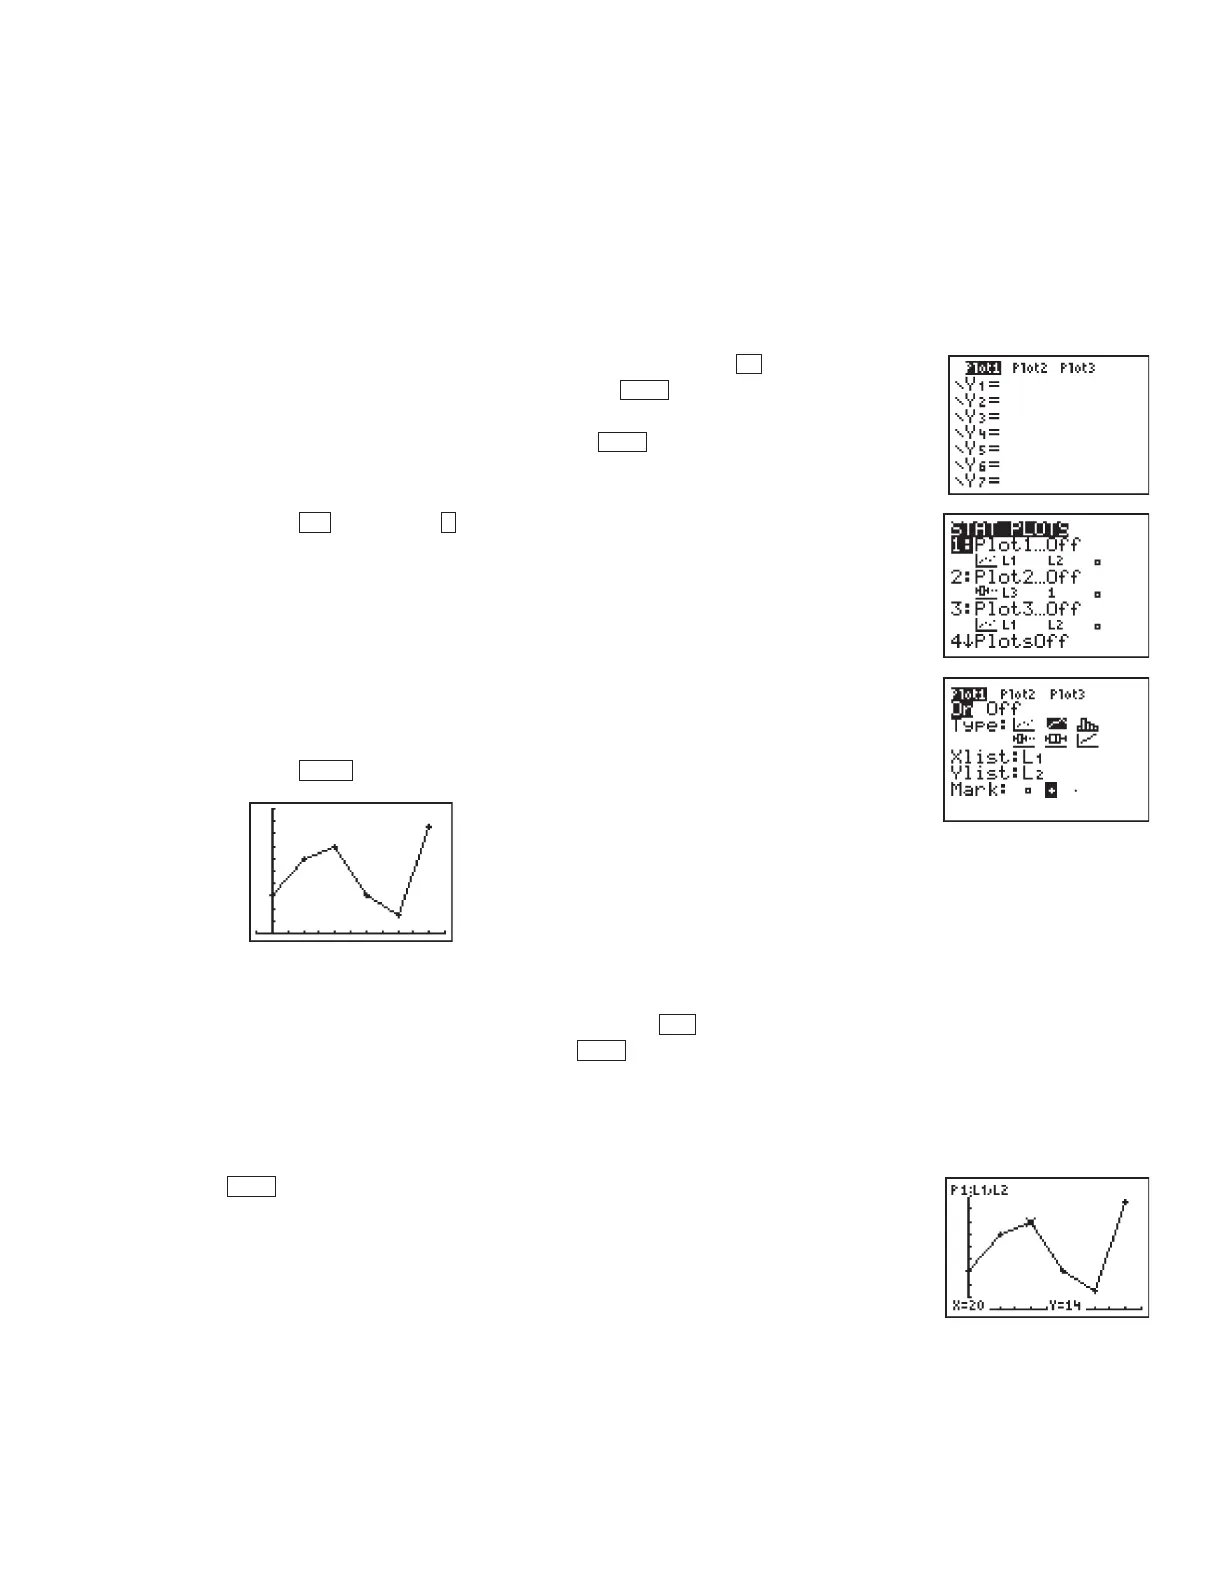
a. Clear or turn off any equations in the Y screen. (Press . Place the
cursor anywhere in an equation and press to delete the equation.
Or, move the cursor over the highlighted equal sign of any equation
that you don’t want to delete, and press to turn off the equation.)
b. Press
[STAT PLOT] (Plot1...). (You can choose any of the three
stat plots.)
c. Select
On, xyLine, L1 for Xlist (if your x-coordinates are in list L1), L2 for
Ylist (if your y-coordinates are in list L2), and choose a mark type to
indicate the data points.
d. Press .
If the points are not listed in ascending order by their x-coordinates, your
xyLine
will be scrambled with the line segments criss-crossing each other. To reorder
your points correctly, go to the Home screen and press and select
2:Sort A(.
Complete the command Sort (L1,L2) and press . Notice that the sort
command puts list
L1 in ascending order but maintains the original pairings
between list
L1 and list L2.(See Note 10B.)
Tracing Connected Points
Press . The trace option always starts with the stat plots and then moves
to equations in the
Y screen (if any are turned on), even if you can’t see them
in the current window. Be sure to turn off any plots and any equations you do
not want to see or trace.
TRACE
ENTER
STAT
GRAPH
12nd
ENTER
CLEAR
Y
DA2CN_773_01.qxd 10/19/05 9:53 Page 19

 Loading...


