©2007 Key Curriculum Press Discovering Algebra Calculator Notes for the Texas Instruments TI-83 and TI-83/84 Plus 21
Note 1I • Reading a Distance Using the DIST Program (continued) TI-83 and TI-83/84 Plus
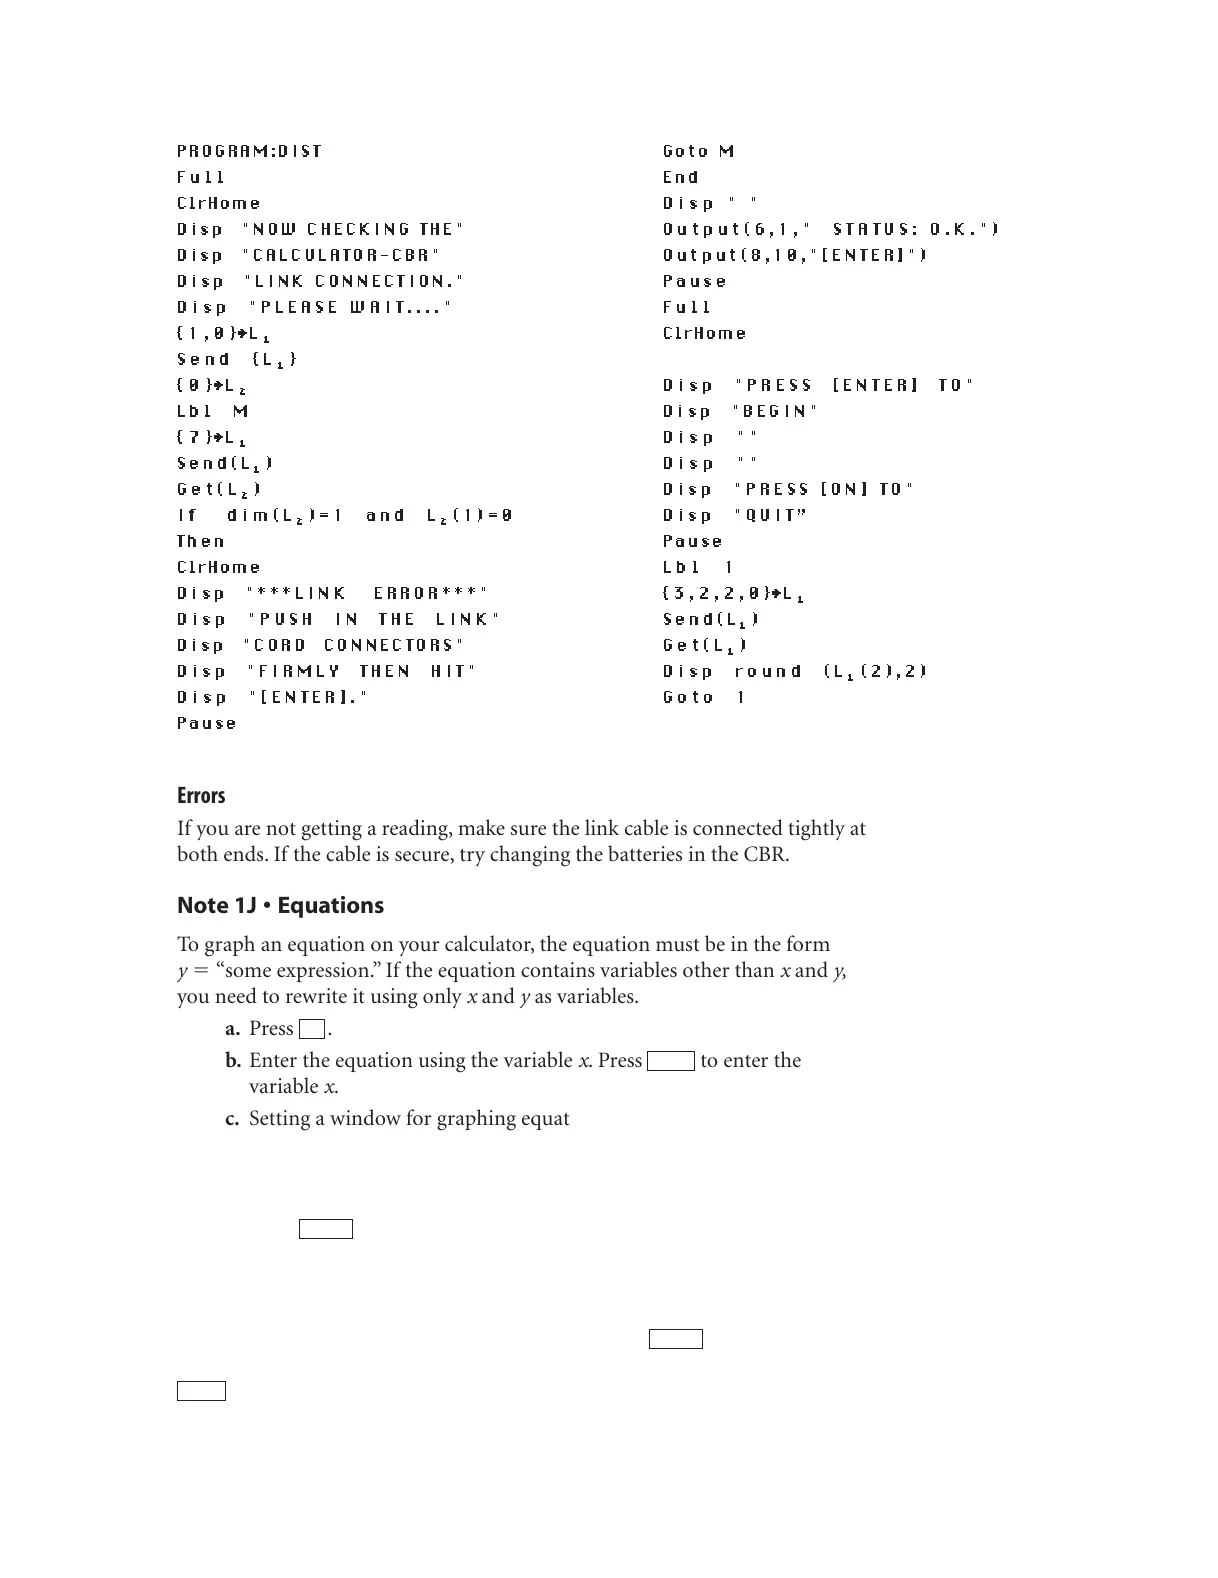
PROGRAM:DIST
Full
ClrHome
Disp "NOW CHECKING THE"
Disp "CALCULATOR-CBR"
Disp "LINK CONNECTION."
Disp "PLEASE WAIT...."
{1,0}
Í
L⁄
Send {L⁄}
{0}
Í
L¤
Lbl M
{7}
Í
L⁄
Send(L⁄)
Get(L¤)
If dim(L¤)=1 and L¤(1)=0
Then
ClrHome
Disp "***LINK ERROR***"
Disp "PUSH IN THE LINK"
Disp "CORD CONNECTORS"
Disp "FIRMLY THEN HIT"
Disp "[ENTER]."
Pause
Goto M
End
Disp " "
Output(6,1," STATUS: O.K.")
Output(8,10,"[ENTER]")
Pause
Full
ClrHome
Disp "PRESS [ENTER] TO"
Disp "BEGIN"
Disp ""
Disp ""
Disp "PRESS [ON] TO"
Disp "QUIT”
Pause
Lbl 1
{3,2,2,0}
Í
L⁄
Send(L⁄)
Get(L⁄)
Disp round (L⁄(2),2)
Goto 1
Errors
If you are not getting a reading, make sure the link cable is connected tightly at
both ends. If the cable is secure, try changing the batteries in the CBR.
Note 1J • Equations
To graph an equation on your calculator, the equation must be in the form
y “some expression.” If the equation contains variables other than x and y,
you need to rewrite it using only x and y as variables.
a. Press .
b. Enter the equation using the variable x.Press to enter the
variable x.
c. Setting a window for graphing equations is not as easy as setting a
window for data. If it is an application problem, think about what
values make sense for both x and y.You may need to try different
windows to find one that is appropriate.
d. Press .
Tracing Equations and Plots on the Same Graph
Enter the data and set up a scatter plot. Enter the equation. Set the window. You
can do these three steps in any order. When you press , you will see the
stat plot graphed first and the equation(s) graphed second. When you press
,you will first trace the data in the stat plot. Press the down arrow to trace
TRACE
GRAPH
GRAPH
X,T,,n
Y
(continued)
DA2CN_773_01.qxd 10/19/05 9:53 Page 21

 Loading...


