The calculator will automatically graph any equations entered in the Y = menu. A note
about ZSquare - it will square the viewing window that is established. You may need to
adjust the initial window setting before using ZSquare.
1.7 Scatter Diagrams; Linear Curve Fitting
Example 1 Drawing a Scatter Diagram
The data listed in Table 9 (see page77) represent the apparent temperature versus relative
humidity in a room whose actual temperature is 72
o
Fahrenheit. Draw a scatter diagram
using a graphing calculator.
Solution
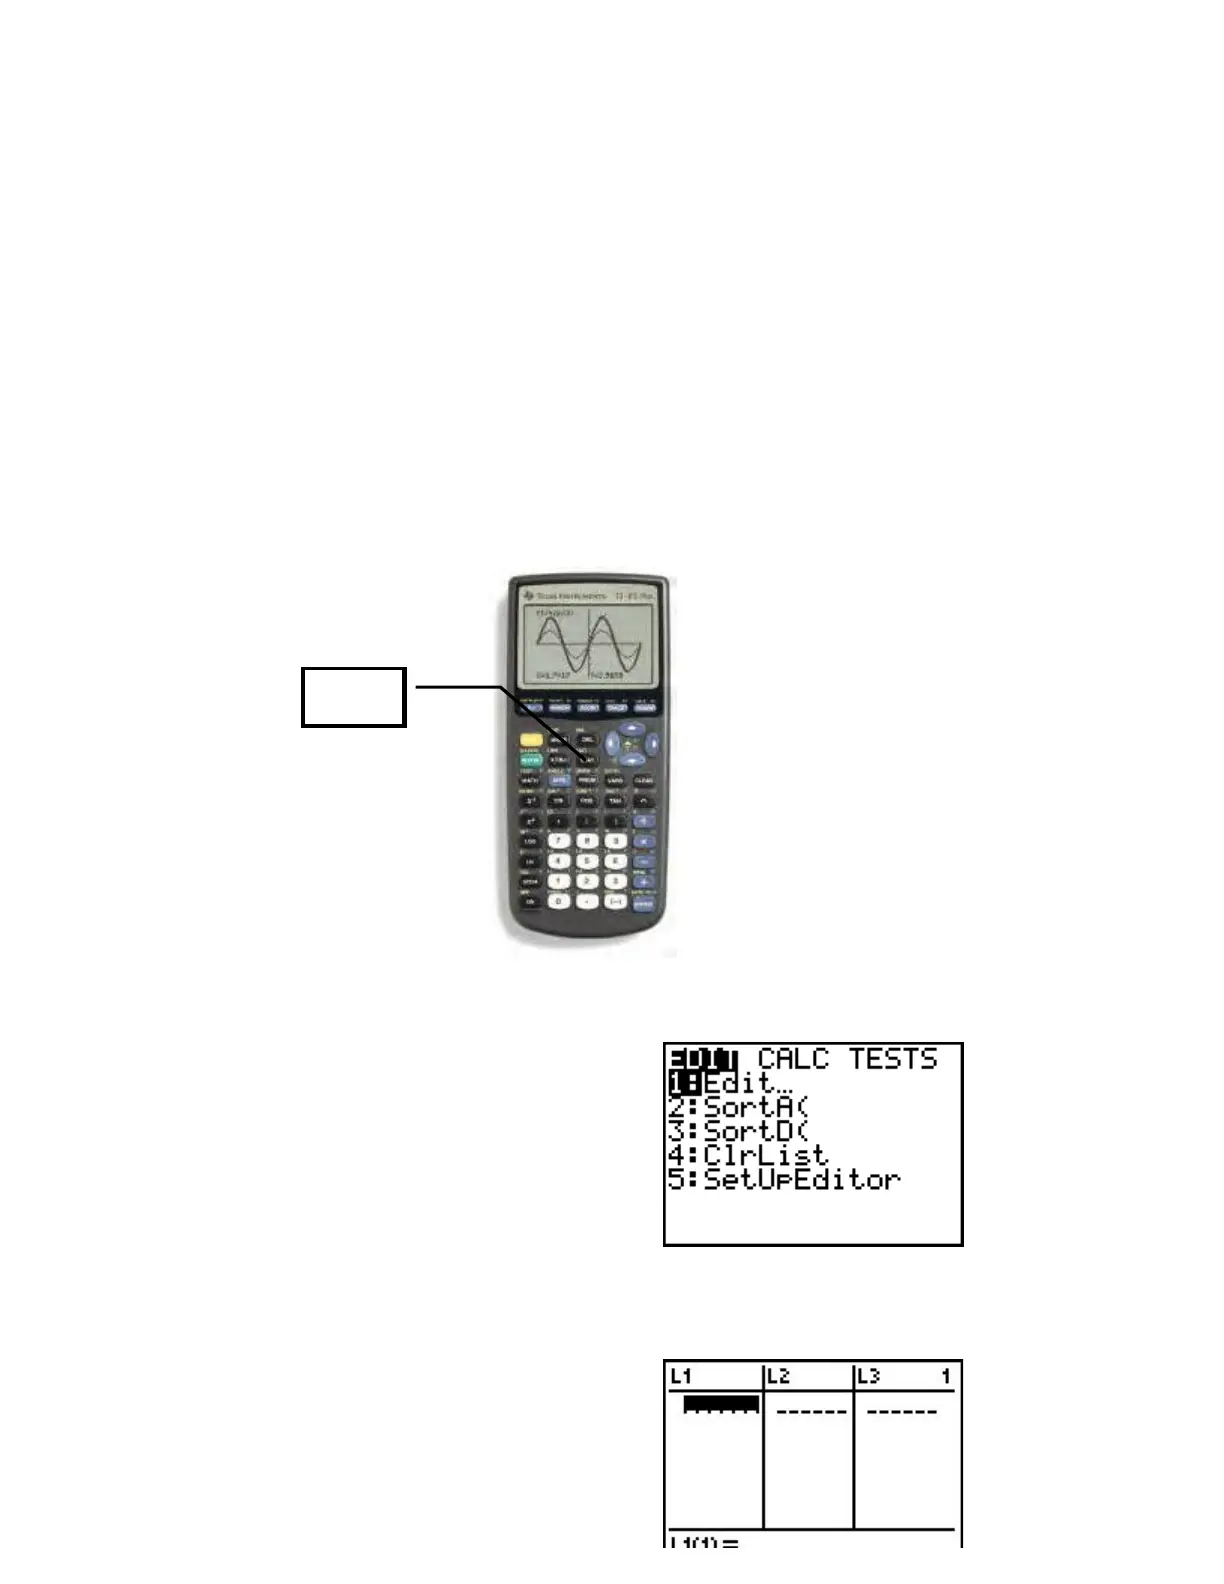
First press the STAT button.
On the screen you should see the following:
Select 1: Edit by either pressing ENTER or pressing 1.
You should now be in the data editor.
STAT