B-6 TI-85/TI-86 Graphing Calculators
Copyright © Houghton Mifflin Company. All rights reserved.
Remove the lower menu with EXIT , and press
F3 (ZOOM) MORE F4 (ZDECM) .
Notice that the graphics screen is blank.
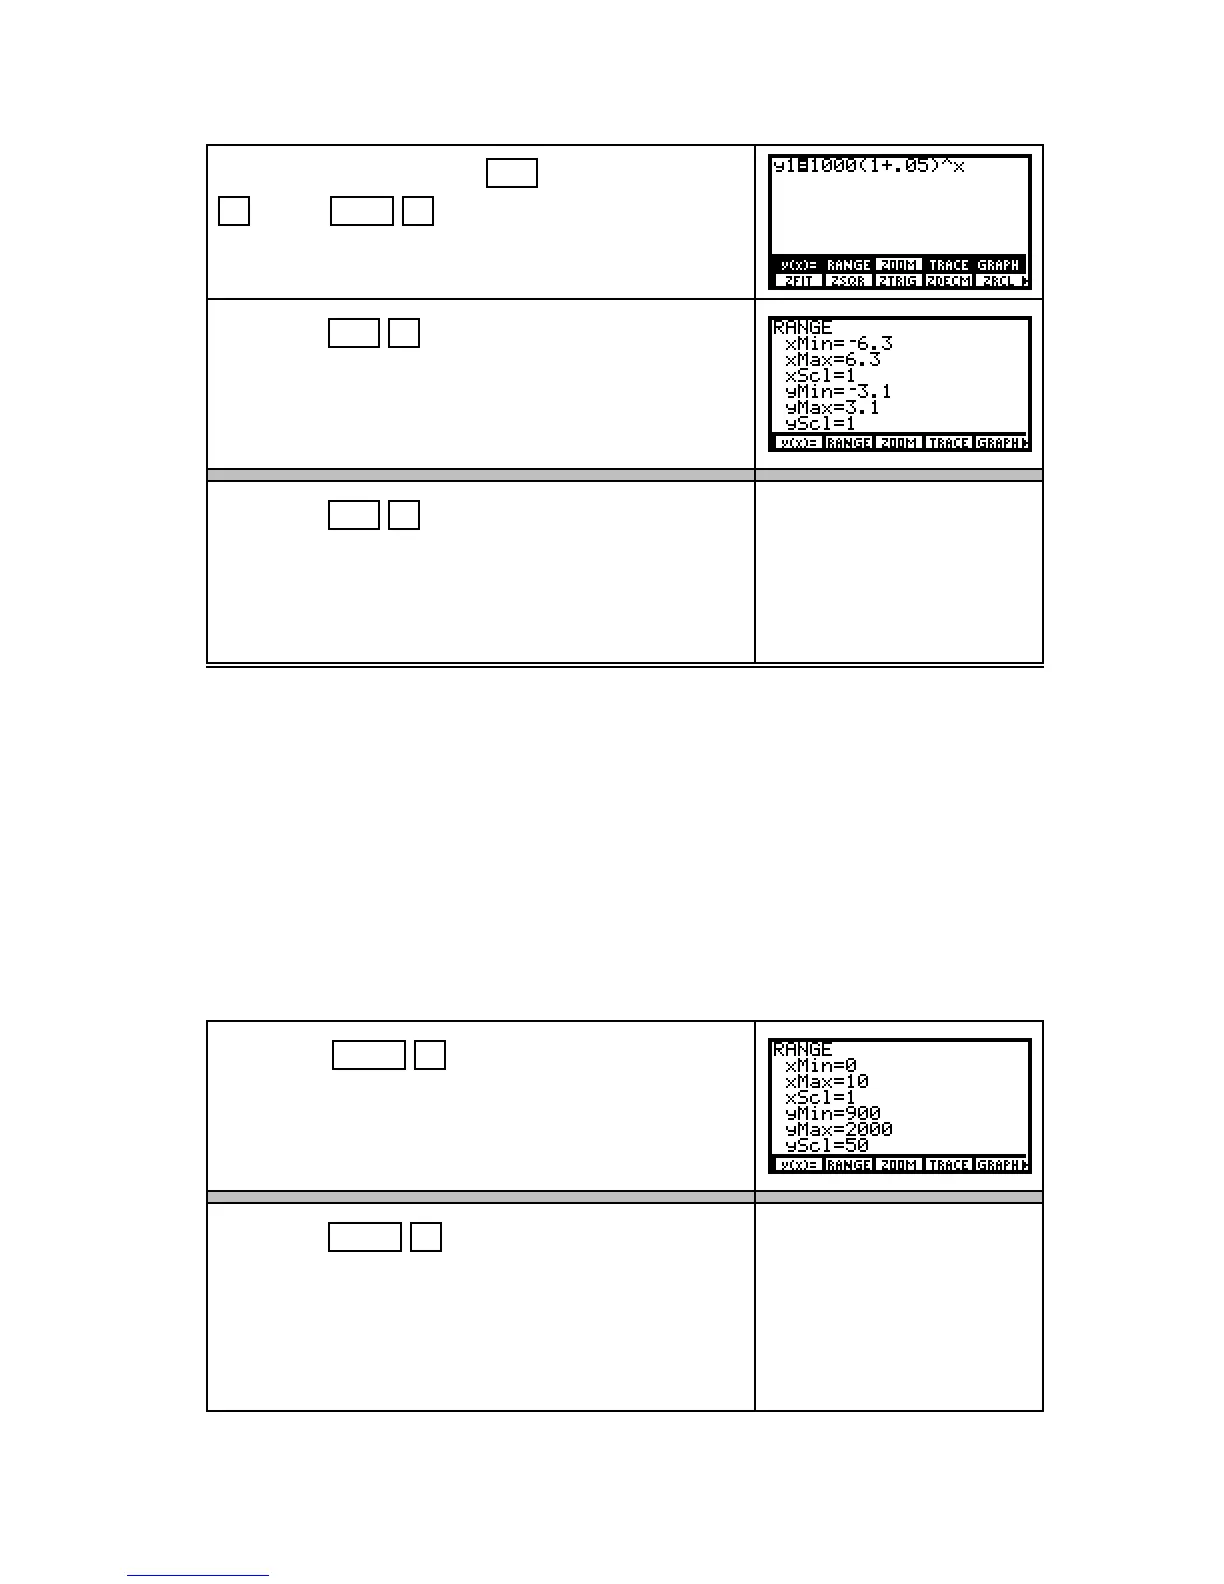
TI-85 Press EXIT F2 (RANGE) to see the view set
by ZDECM.
TI-86 Press EXIT F2 (WIND) to see the view set
by ZDECM.
¥ Both xMin and xMax are the settings of the left and right edges of the viewing screen,
and yMin and yMax are the settings for the lower and upper edges of the viewing
screen. xScl and yScl set the spacing between the tick marks on the x- and y-axes.
The view you see is
–
6.3 £ x £ 6.3,
–
3.1 £ y £ 3.1.
Follow the procedures shown in either 1.1.3 or 1.1.4 to draw a graph with your calculator.
Whenever you draw a graph, you have the option of manually changing the view or having
the calculator automatically find a view of the graph.
1.1.3 MANUALLY CHANGING THE VIEW OF A GRAPH If you do not have a
good view of the graph or if you do not see the graph, change the view with one of t h e
ZOOM options or manually set the view. (We later discuss the ZOOM options.)
TI 85 Press GRAPH F2 (RANGE) .
Set xMin to 0, xMax to 10, leave xScl at 1, set yMin to 900,
yMax to 2000, and yScl to 50.
TI 86 Press GRAPH F2 (WIND) .
Set xMin to 0, xMax to 10, leave xScl at 1, set yMin to 900,
yMax to 2000, and yScl to 50.
Below yScl is a setting called xRes. For all appli-
cations in this Guide, have xRes set to 1.

 Loading...


