TI-89 Guide
TI89-13
Copyright © Houghton Mifflin Company. All rights reserved.
1.1.9 GRAPHICALLY FINDI NG INTERCEPTS Finding the input value at which the graph
of a function crosses the vertical and/or horizontal axis can be found graphically, by using the
solve instruction on the entry line, or by using the numeric solver. Remember the process by
which we find intercepts:
• To find the y-intercept of a function y=f(x), set x = 0 and solve the resulting equation.
• To find the x-intercept of a function y=f(x), set y = 0 and solve the resulting equation.
An intercept is the where the graph crosses or touches an axis. Also remember that the x-
intercept of the function y=f(x) has the same value as the root or solution of the equation
f(x)=0. Thus, finding the x-intercept of the graph of f(x)–c= 0 is the same as solving the
equation f(x)=c.
We illustrate this method with a problem similar to the one in Activity 40 in Section 1.1 of
Calculus Concepts. You should practice by solving the equation 3.622(1.093
x
) = 20 using this
graphical method and by solving the equation that follows using one of the solvers
.
Suppose we are asked to find the input value of f(x)=3x–0.8x
2
+ 4 that corresponds to the
output f(x) = 2.3. That is, we are asked to find x such that 3x –0.8x
2
+4=2.3. Becausethis
function is not given in a context, we have no indication of an interval of input values to use
when drawing the graph. We will use the zoom features to set an initial view and then manually
set the
WINDOW
until we see a graph that shows the important points of the func-tion (in this
case, the intercept or intercepts.) You can solve this equation graphically using either the x-
intercept method or the intersection method. We present both, and you should use the one you
prefer.
X
-INTERCEPT METHOD
for solving the equation f(x)–c=0:
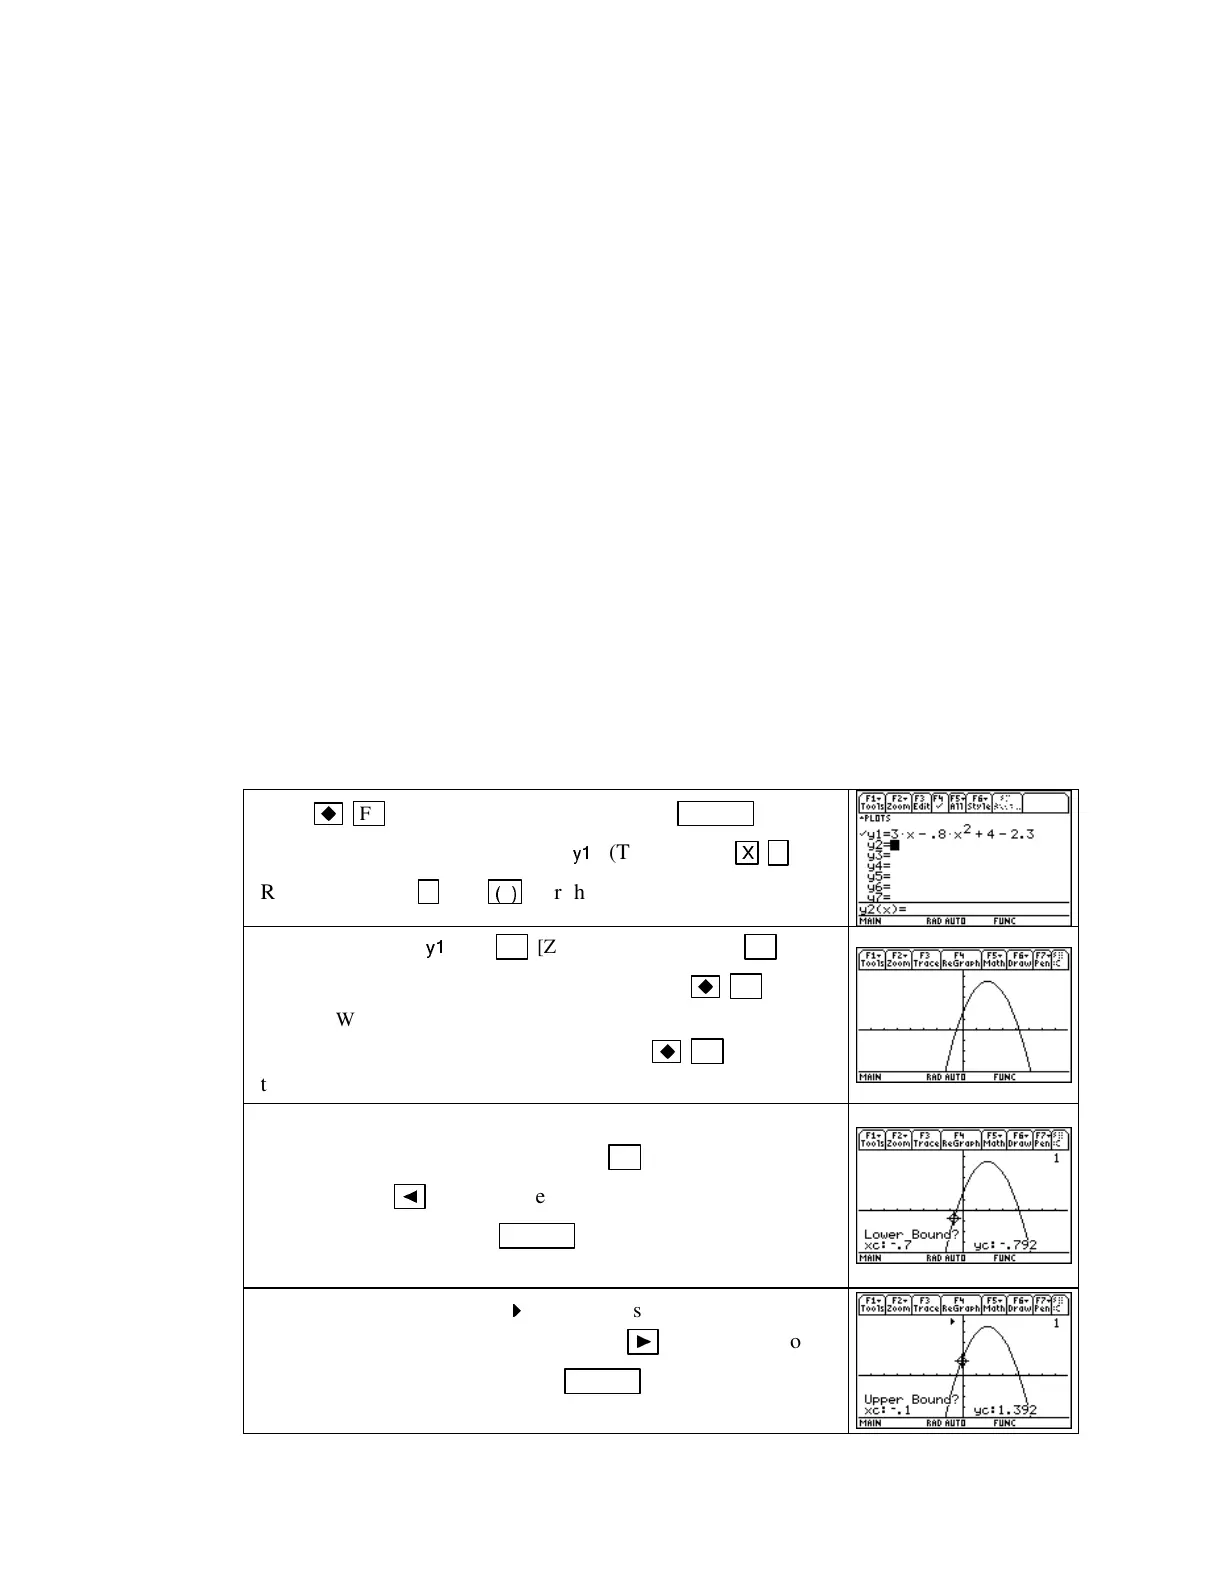
Press
F1 (Y
=
)
and clear all locations with
CLEAR .
Enter
the function 3x –0.8x
2
+4–2.3in
y1
.(Typex
2
with
X
^ 2.
Remember to use
−
, not
(
−
)
, for the subtraction signs.)
Draw the graph of
y1
with
F2 [Zoom] 4 [ZoomDec] or F2
[Zoom] 6 [ZoomStd].
If you use the former, press
F2
(WINDOW)
and reset
ymax
to
5.5
to get a better view of the top
of the graph. (If you reset the window, press
F3 (GRAPH)
to redraw the graph.)
To graphically find an x-intercept, i.e.,avalueofxat which the
graph crosses the horizontal axis, press
F5 [Math] 2 [Zero].
Press and hold
◄
until you are near, but to the left of, the
leftmost x-intercept. Press
ENTER
to mark the location of the
lower bound for the x-intercept.
Notice the small arrowhead (
) that appears above the location to
mark the left bound. Now press and hold
►
until you are to
the right of this x-intercept. Press
ENTER
to mark the location
of the upper bound for the x-interceptandtofindit.
 Loading...


