TI-89 Guide
TI89-29
Copyright © Houghton Mifflin Company. All rights reserved.
Press
F1 (Y
=
)
and
▲
.
Notice that
Plot1
at the top of the
screen has a check mark to the left of the name. This tells you
that
Plot1
is turned on and ready to be graphed. You can also see
the settings you chose for the plot.
•
A scatter plot is turned on whenthereisacheckmarktotheleftofitsnameonthe
Y=
screen. From now on, you can turn the scatter plot off and on by having
Plot1
either
checked or not checked. To turn
Plot1
off, press
F4 [
b
]
to remove the check mark.
Reverse the process to turn
Plot1
back on.
•
TI-89 data lists can be named and stored in the calculator’s memory for later recall and use.
Refer to Section 1.5.13 and 1.5.14 of this Guide for instructions on storing data lists and
later recalling them for use.
1.5.6 DRAWI NG A SCATTER PLOT OF DATA Anyfunctionsthatareturnedoninthe
Y=
list
will graph when you plot data. Therefore, you should clear or turn them off before you draw a
scatter plot. We illustrate how to graph data using the modified tax data that follows Example
2inSection1.5ofCalculus Concepts.
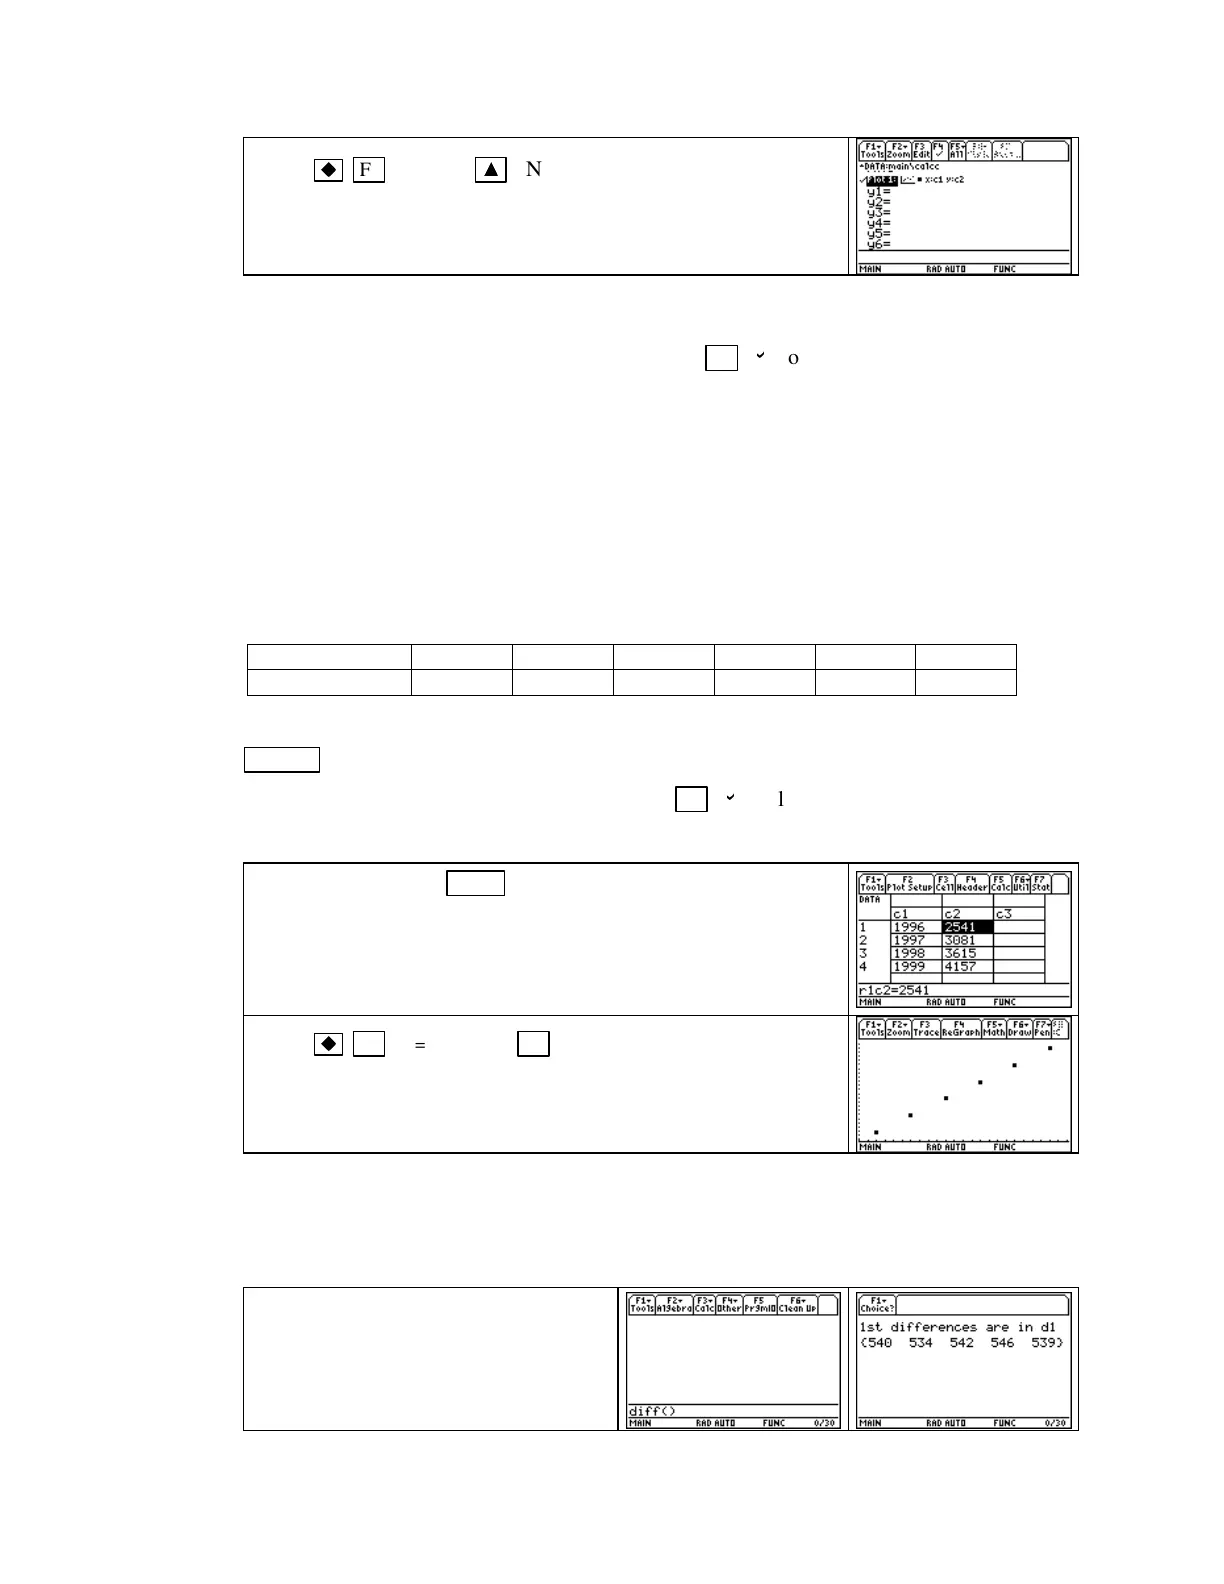
Year 1996 1997 1998 1999 2000 2001
Tax (in dollars) 2541 3081 3615 4157 4703 5242
Access the
Y=
graphing list. If any entered function is no longer needed, clear it by pressing
CLEAR .
If you want the function(s) to remain but not graph when you draw the scatter plot,
remove the check mark next to that function with
F4 [
b
].
Also be sure that
Plot 1
at the top of
the
Y=
screen is turned on (i.e., checked).
Access the data with
APPS 6 [Data/Matrix Editor]
and choose
1
[Current].
Using the table given above, enter the year data in
c1
and the modified tax data in
c2
according to the instructions
given in Section 1.5.1 of this Guide.
(You can either leave values in the other lists or clear them.)
Press
F1 (Y
=
)
and then
F2 [Zoom] 9 [ZoomData]
to have
the calculator set an autoscaled view of the data and draw the
scatter plot. (Note that
ZoomData
also resets the x- and y-axis
tick marks.)
Recall that if the data are perfectly linear (that is, every data point falls on the graph of a line),
the first differences in the output values are constant. The first differences for the original tax
data were constant at $541, so a linear function fit the data perfectly. What information is
given by the first differences for these modified tax data?
Run program
DIFF.
(See Section 1.5.4
of this Guide.) Recall that the program
stores the first differences in list
d1
if
you want to recall them on the home
screen.

 Loading...


