TI89-30
Chapt er 1
Copyright © Houghton Mifflin Company. All rights reserved.
These first differences are close to being constant. This information, together with the linear
pattern shown by the scatter plot, are a good indication that a linear function is likely to give a
good fit to the data.
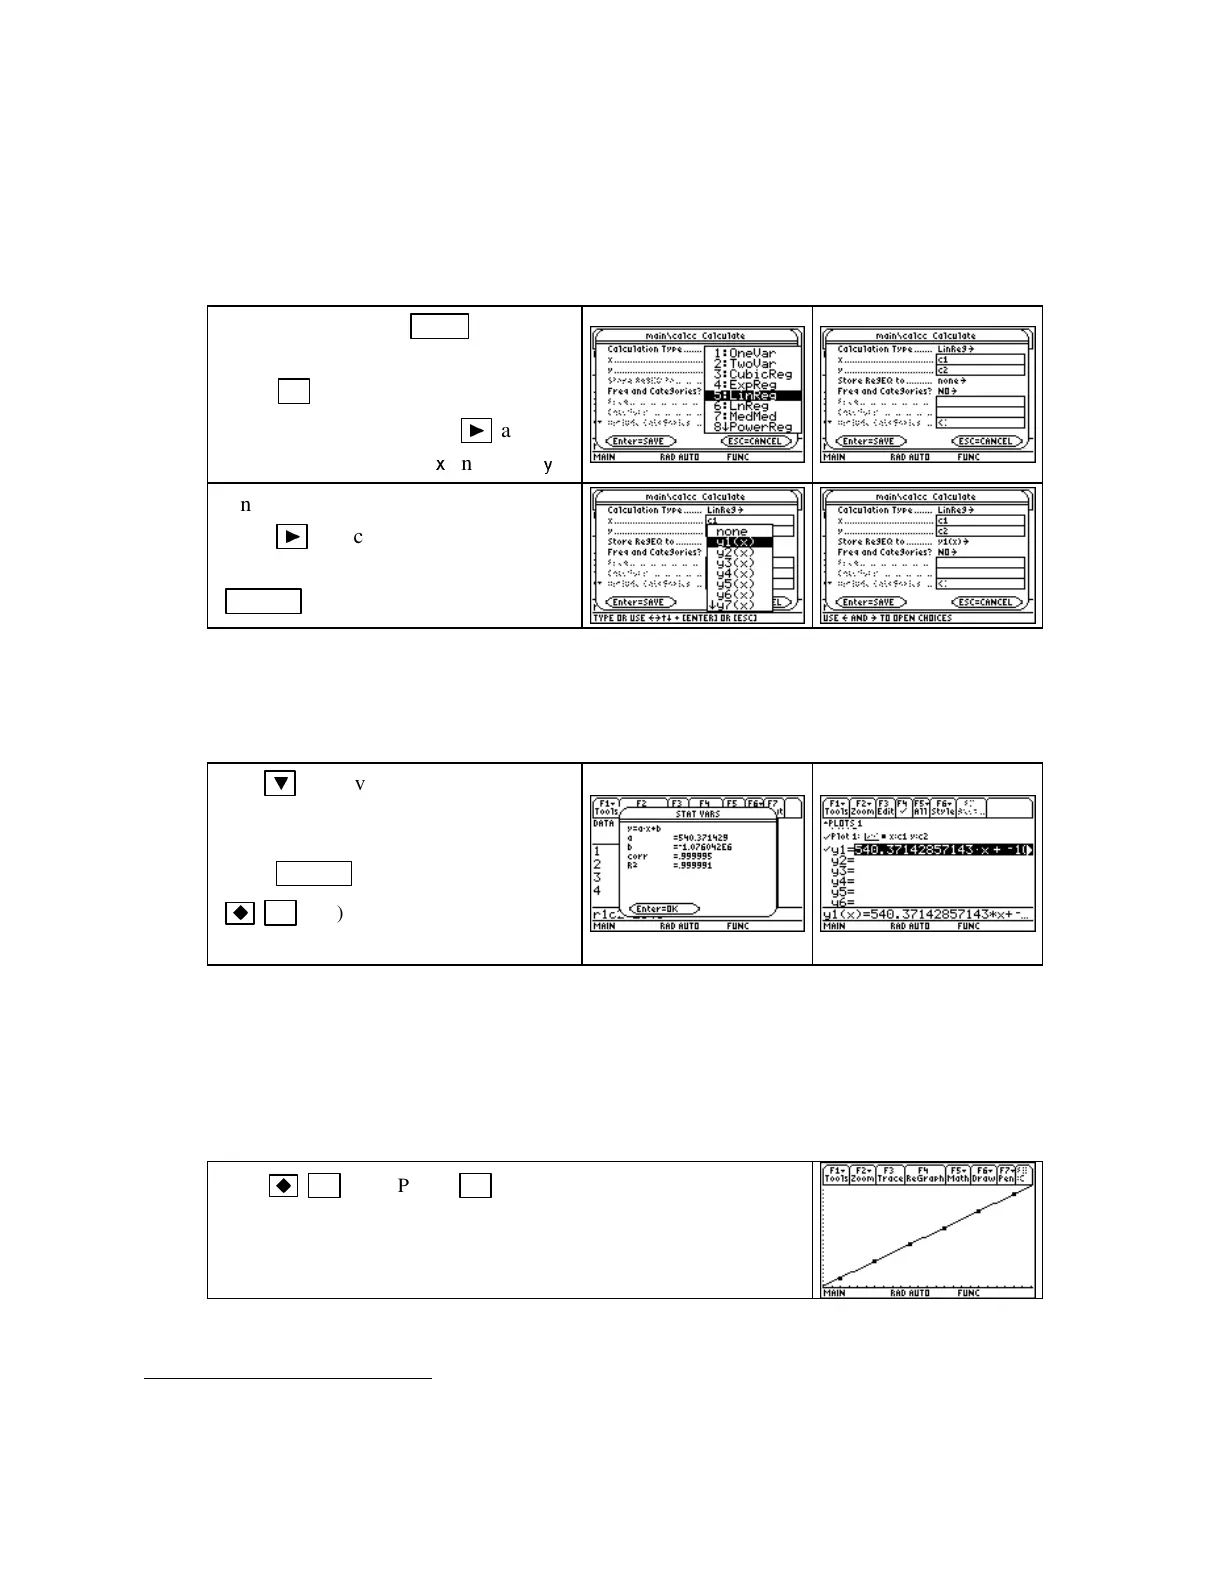
1.5.7 FI NDING A LI NEAR FUNCTION TO MODEL DATA You will often have your TI-89
find the linear function that best fits a set of data. Other functions are fit using the same steps.
Access the data with
APPS 6 [Data/
Matrix Editor]
and choose
1 [Current].
Press
F5 [Calc].
On the first line
(Calculation Type…)
,press
►
and
5
[LinReg].
Type in
c1
for
x
and
c2
for
y
.
On the fourth line
(Store RegEQ to…)
,
press
►
and choose where you want
to paste the linear function. Press
ENTER .
CAUTI ON: The best-fit function found by the calculator is also called a regression function.
The coefficients of the regression function never should be rounded! This is not a problem
because the calculator pastes the entire equation it finds into the
Y=
listatthesametimethe
function is found if you follow the instructions given above.
Use
▼
to move between the various
options in the
Calculate
screen. When
you have entered all the information,
press
ENTER
to exit the screen. Press
F1 (Y
=
)
and see that the function
has been pasted in the chosen location.
CAUTI ON: The number that is labeled corr on the
STAT VARS
screen is called the correla-
tion coefficient. This value and the one labeled R
2
,whichisthecoefficient of determination,
are numbers that you will learn about in a statistics course. It is not appropriate
5
to use these
values in a calculus course.
Graphing the Line of Best Fit: After finding a best-fit equation, you should always draw the
graph of the function on a scatter plot to verify that the function provides a good fit to the data.
Press
F3 (GRAPH)
or
F2 [Zoom] 9 [ZoomData]
to over-
draw the function on the scatter plot of the data.
(As we suspected from looking at the scatter plot and the first
differences, this function provides a very good fit to the data.)
5
Unfortunately, there is no single number that can be used to tell whether one function better fits data than another. The
correlation coefficient only compares linear fits and should not be used to compare the fits of different types of functions.
For the statistical reasoning behind this statement, read the references in footnote 8 on page C-35.

 Loading...


