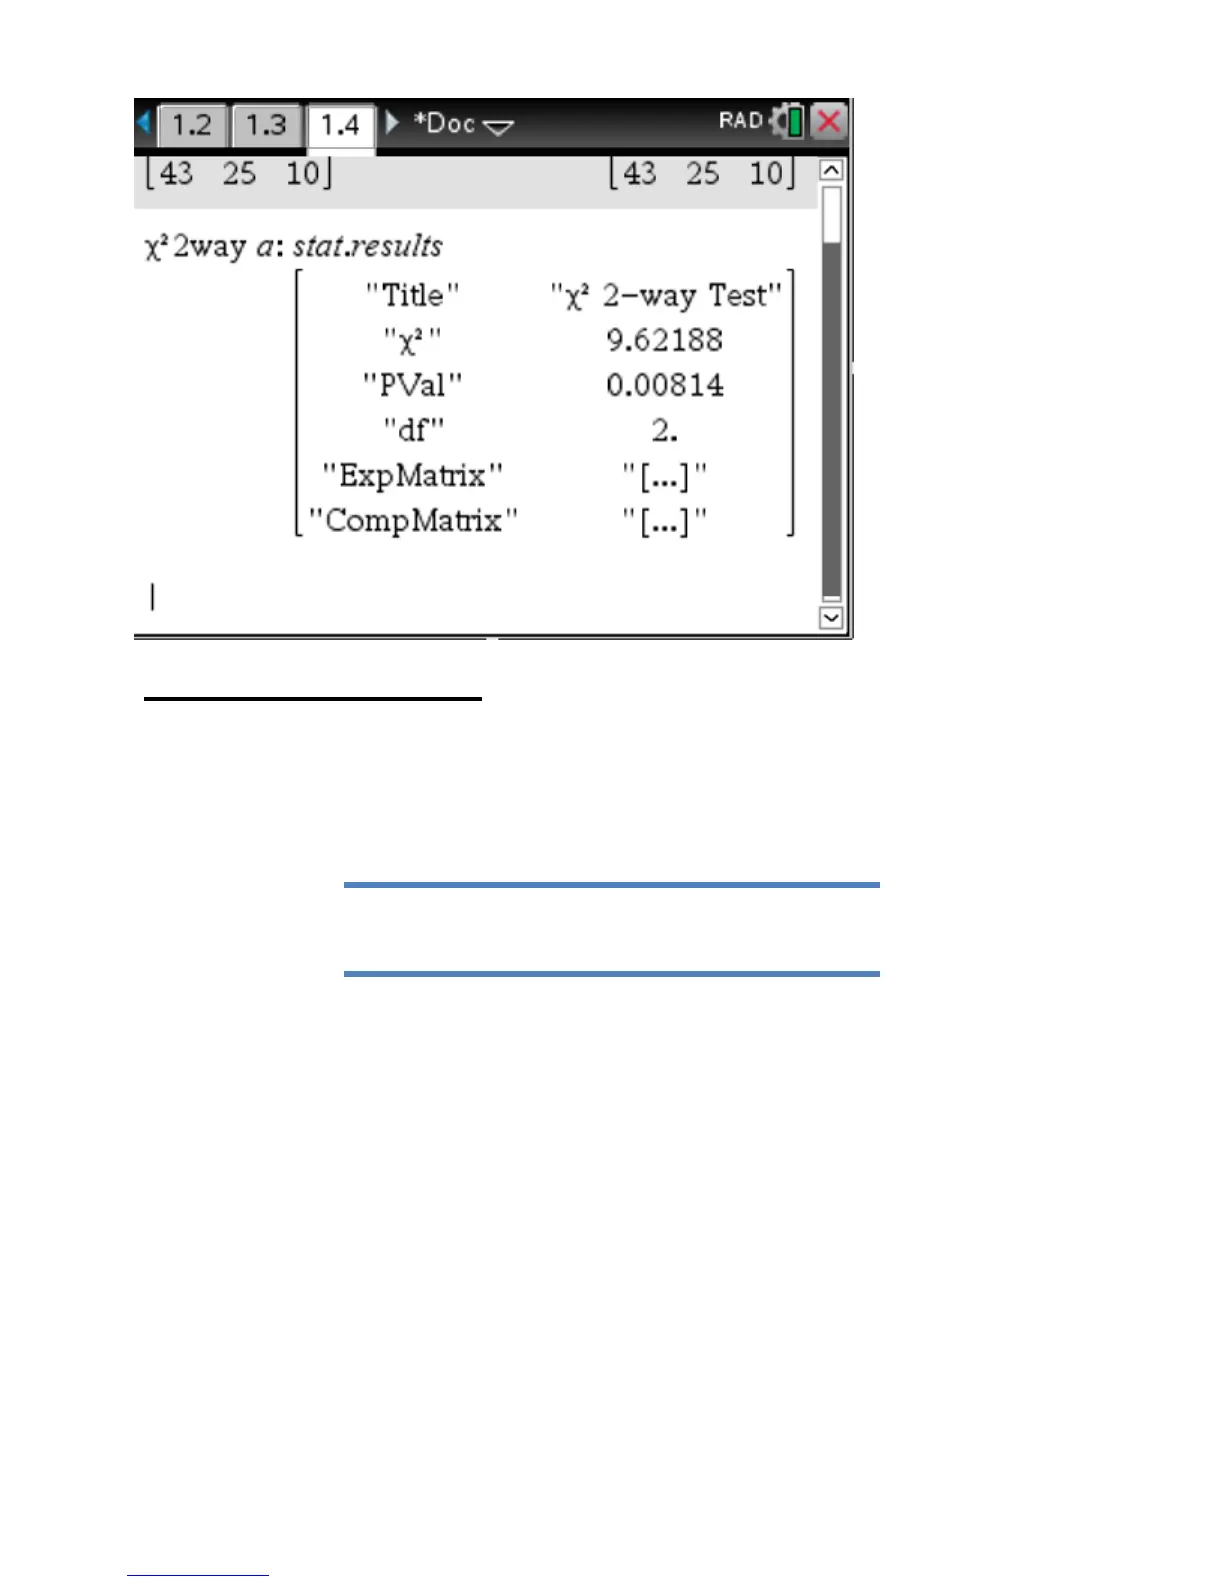
Goodness of Fit 1 X
Put observed numbers in column a(and name)
Put expected number in column b ( and name)
Expected can be either
1. Total divided by number of factors; You are saying that all factors will
have equal amounts i.e. In the case of bags of M&M’s you would be
saying that there is an equal number of each color in each bag
There are an average of 35 peanut M & Ms in each package and there are 6 colors
35/6 =5.8
2. A known statistic you are comparing your results to./ ie. We compare the
number of M&M’s, by color, in a sample of bags to the number of each
color the company claims on its website.
Assuming a bag of 35 then by percent it would be 9 blue, 8 orange, 4 green, 5 yellow, 5
red and 4 blue(roughly)
[Menu]
M&M’S PEANUT: 23% cyan blue, 23% orange, 15%
green, 15% bright yellow, 12% red, 12% brown.
 Loading...


