EasyManuals Logo

Texas Instruments TI Programmable 57 User Manual

Texas Instruments TI Programmable 57
94 pages
To Next Page IconTo Next Page
To Previous Page IconTo Previous Page
Page #72 background imageLoading...
Page #72 background image
As
most
of
us
progress
through
school
or
business,
there
will
be
times
when
we
would
like
to
predict
the
outcome
of
some
future
event
based
on
our
knowledge
of
how
similar
things
have
gone
in
the
past.
You
might
want
to
predict
the
effects
of
changes
in
diet
on
animal
growth
in
the
biology
lab.
Or
if
you're
a
businessman,
you
might
want
to
predict
what
effect
an
increase
in
advertising
will
have
on
product
sales.
In
either
case
you
want
to
be
able
to
take
a
known
set
of
data,
and
use
it
to
establish
a
straight
line
graph,
and
then
predict
from
the
line
what
the
outcome
should
be
in
the
future.
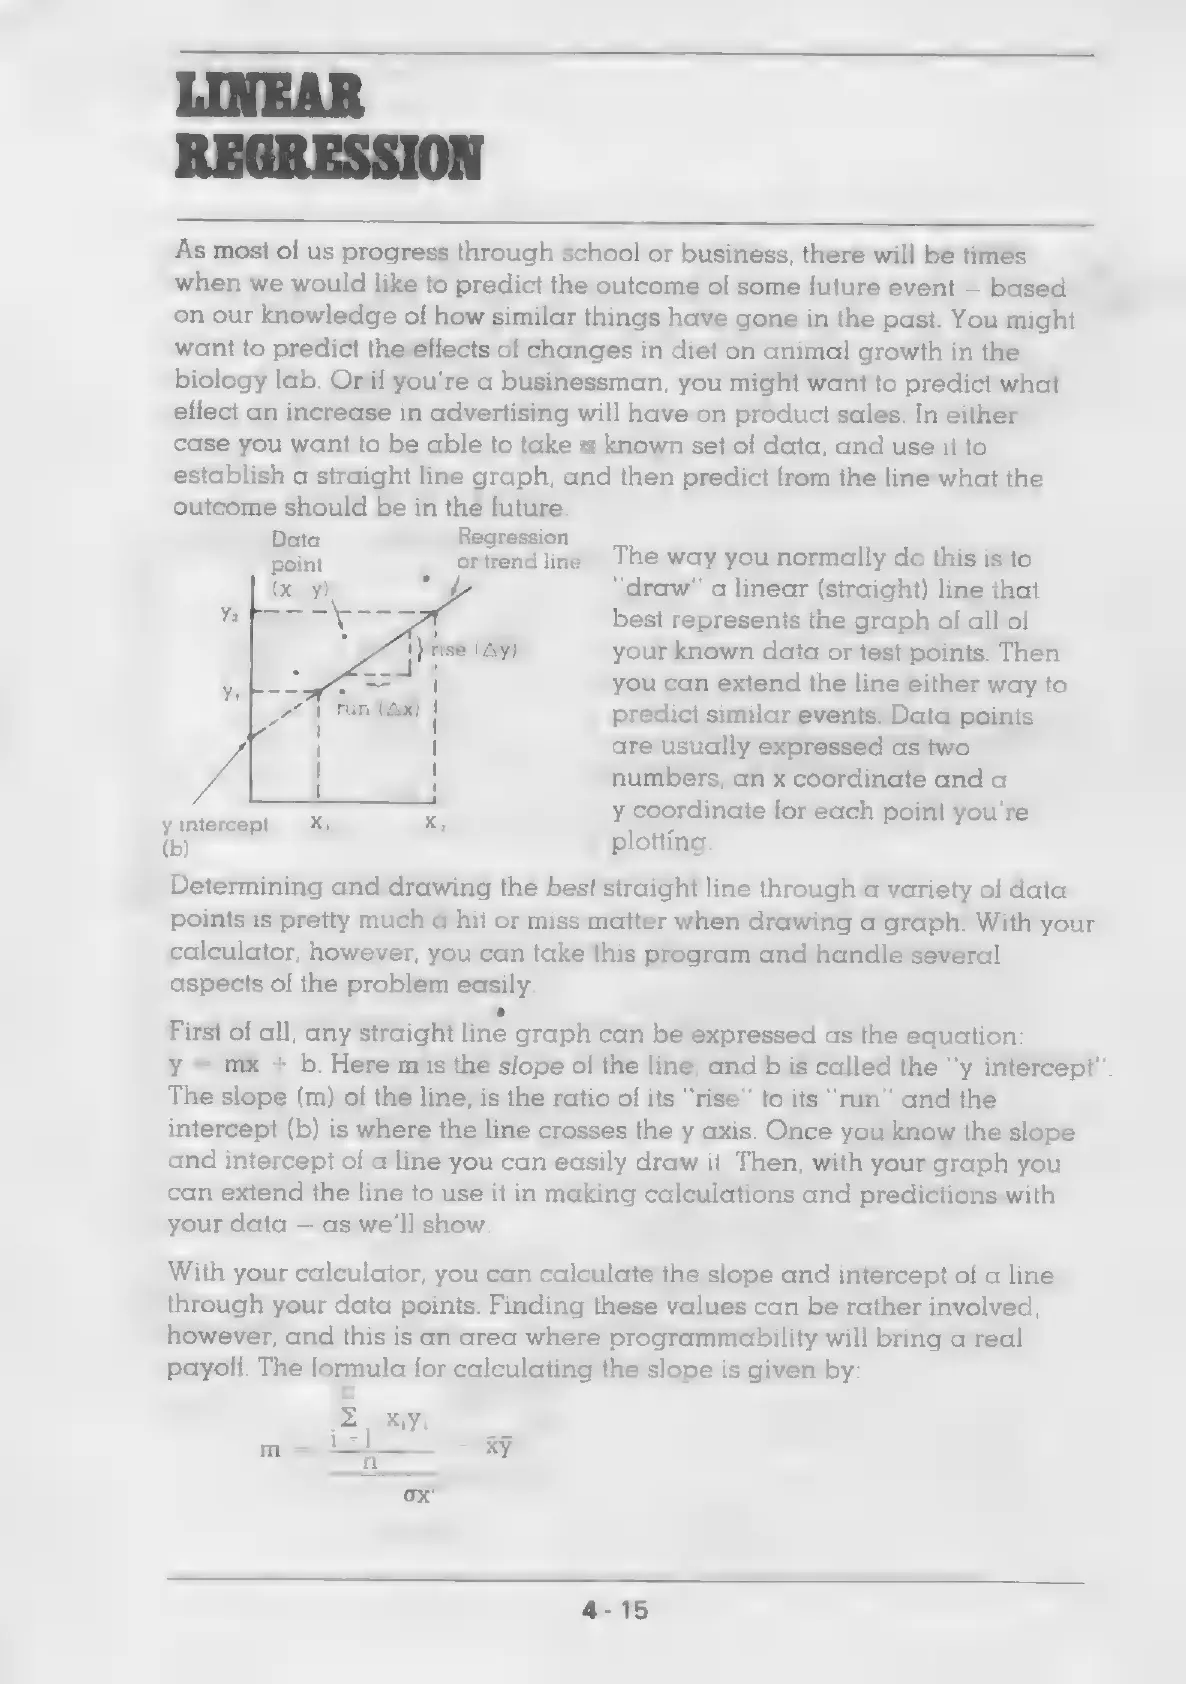
Dat
Regression
Ae,
point
ortrendline
The
way
you
normally
do
this
is
to
noorig
‘draw’
a
linear
(straight)
line
that
best
represents
the
graph
of
all
of
your
known
data
or
test
points.
Then
you
can
extend
the
line
either
way
to
predict
similar
events.
Data
points
are
usually
expressed
as
two
numbers,
an
x
coordinate
and
a
RAMEE)
=
y
coordinate
for
each
point
you're
1)
:
plotting.
Determining
and
drawing
the
best
straight
line
through
a
variety
of
data
points
is
pretty
much
a
hit
or
miss
matter
when
drawing
a
graph.
With
your
calculator,
however,
you
can
take
this
program
and
handle
several
aspects
of
the
problem
easily.
Ya
First
of
all,
any
straight
line
graph
can
be
expressed
as
the
equation:
y
=
mx
+
b.
Here
mis
the
slope
of
the
line,
and
b
is
called
the
‘y
intercept"’.
The
slope
(m)
of
the
line,
is
the
ratio
of
its
“rise”
to
its
“run”
and
the
intercept
(b)
is
where
the
line
crosses
the
y
axis.
Once
you
know
the
slope
and
intercept
of
a
line
you
can
easily
draw
it.
Then,
with
your
graph
you
can
extend
the
line
to
use
it
in
making
calculations
and
predictions
with
your
data
as
we'll
show.
With
your
calculator,
you
can
calculate
the
slope
and
intercept
of
a
line
through
your
data
points.
Finding
these
values
can
be
rather
involved,
however,
and
this
is
an
area
where
programmability
will
bring
a
real
payoff.
The
formula
for
calculating
the
slope
is
given
by:
n
=.
MY
m=
os
~
x

Questions and Answers:

Question and Answer IconNeed help?

Do you have a question about the Texas Instruments TI Programmable 57 and is the answer not in the manual?

Texas Instruments TI Programmable 57 Specifications

General IconGeneral
BrandTexas Instruments
ModelTI Programmable 57
CategoryCalculator
LanguageEnglish

Related product manuals