EasyManuals Logo

Texas Instruments TI Programmable 57 User Manual

Texas Instruments TI Programmable 57
94 pages
To Next Page IconTo Next Page
To Previous Page IconTo Previous Page
Page #77 background imageLoading...
Page #77 background image
EEE
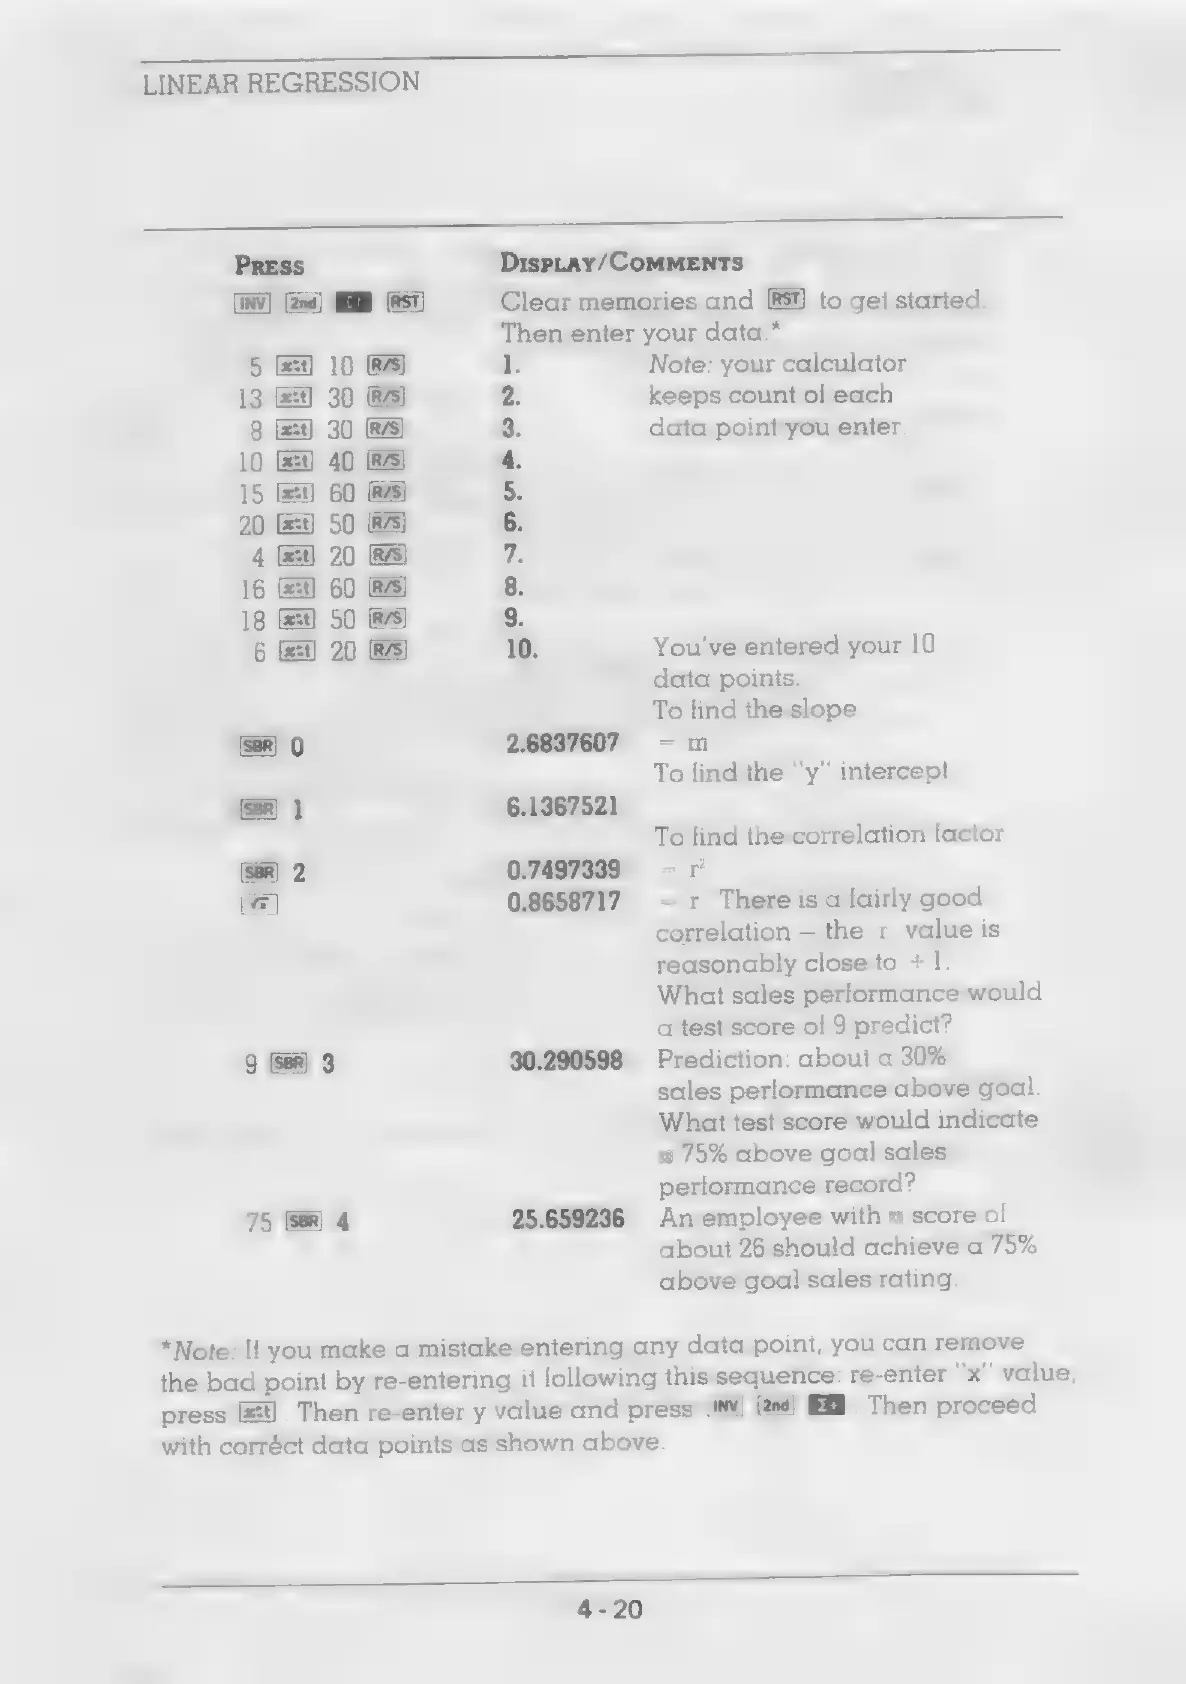
LINEAR
REGRESSION
EEE
Press
[inv]
gi
5
ft]
10
A
13
&#)
30
tes
8
Gt]
30
RA)
3.
10
ft)
40
4.
15
Get]
60
5.
20
(t)
50
6.
4
f=]
20
RA)
7.
16
[zt]
60
8.
18
Get)
50
9.
6
[zt]
20
10.
0
2.6837607
1
6.1367521
2
0.7497339
0.8658717
9
3
30.290598
75
4
25.659236
DispLay/CoMMENTS
Clear
memories
and
to
get
started.
Then
enter
your
data.*
Note:
your
calculator
keeps
count
of
each
data
point
you
enter.
You've
entered
your
10
data
points.
To
find
the
slope
=m
To
find
the
“y”
intercept
To
find
the
correlation
factor
=
fy
=r
Thereisa
fairly
good
correlation
the
r
value
is
reasonably
close
to
+
1.
What
sales
performance
would
a
test
score
of
9
predict?
Prediction:
about
a
30%
sales
performance
above
goal.
What
test
score
would
indicate
a
75%
above
goal
sales
performance
record?
An
employee
with
a
score
of
about
26
should
achieve
a
75%
above
goal
sales
rating.
*Note:
If
you
make
a
mistake
entering
any
data
point,
you
can
remove
the
bad
point
by
re-entering
it
following
this
sequence:
re-enter
“x”
value,
press
1].
Then
re-enter
y
value
and
press
[18]
.
Then
proceed
with
corréct
data
points
as
shown
above.

Questions and Answers:

Question and Answer IconNeed help?

Do you have a question about the Texas Instruments TI Programmable 57 and is the answer not in the manual?

Texas Instruments TI Programmable 57 Specifications

General IconGeneral
BrandTexas Instruments
ModelTI Programmable 57
CategoryCalculator
LanguageEnglish

Related product manuals