Device History on device.watttime.org
You can see how your device responds to local emissions on a graph that looks something like this:
Additional Resources
my device
begins being
tracked!
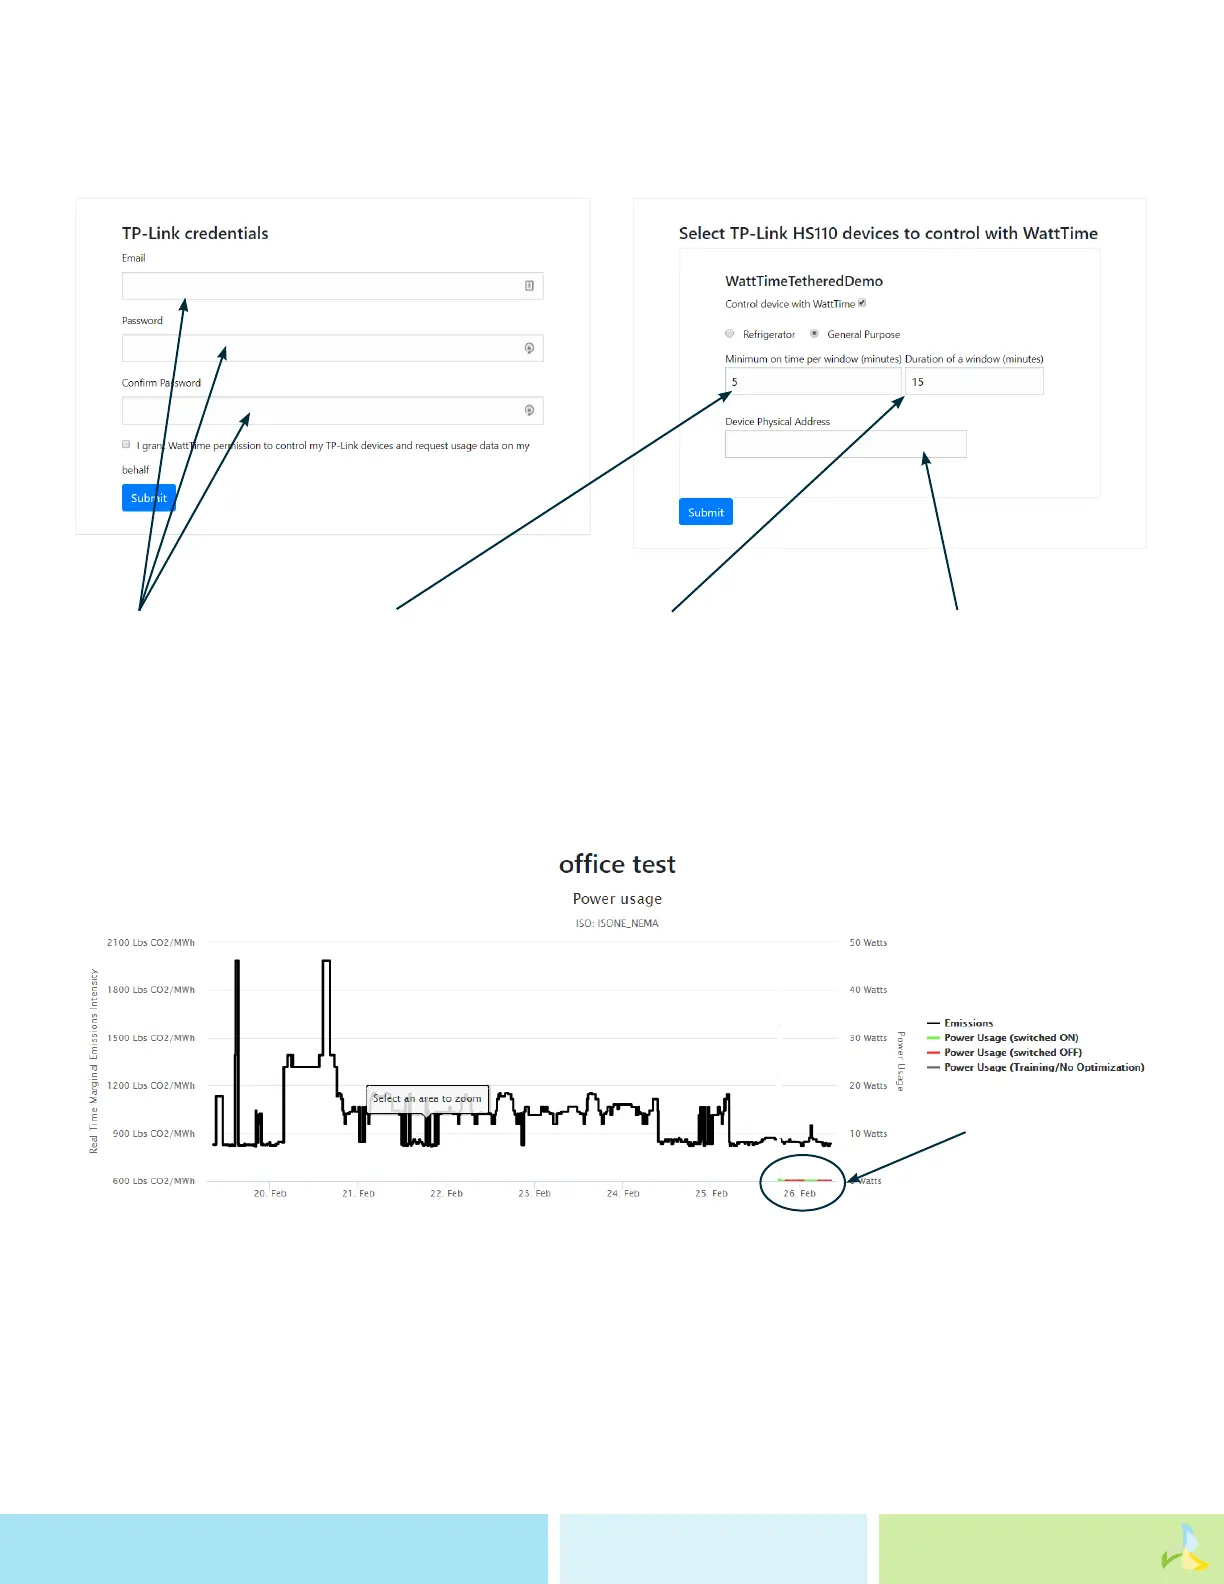
Enter your Kasa app
credentials here
Provide the amout of time
you want your device to
run during every window
Enter the length of the win-
dow during which WattTime
will optimize your device
Provide the address
of your device
Manage Devices on device.watttime.org
When you’re logged in, you should see something like this:
The legend tells you that the black line reects emissions. You can also see the date you started tracking your device and
a condensed look at when the device turned on and o in response to the grid emissions via the green and red bars.
The longer your device is set-up, the more data this graph shows. Until you have more data to show, you can click on the
blue “options” button and run the “Demo/Test” to see an example of how WattTime’s AER works.