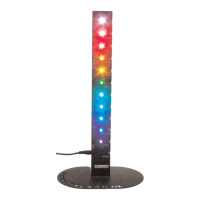
5. How LEDs generate light
In the p-region of an LED, there are many
more positive than negative charges.
In the n-region electrons are more
numerous than positive electric charges.
When sufficient voltage is applied across
the LED, electrons gain enough energy to
move across the junction between p and n
regions, into the p-region.
Once in the p-region, the electrons are
immediately attracted to the positive
charge due to Coulomb forces between
the opposite charges and they re-combine.
For each re-combination the electric
potential energy of the electron is released
as a quantum of electromagnetic energy.
This release takes the form of a photon of
light in a very narrow frequency range,
that is a characteristic of the doped
semiconductor material.
If the applied excitation voltage exceeds
the level at which photons are just emitted,
then the excess energy appears mainly as
phonons (quanta of lattice vibrational
energy).
Calculating photon energy
The energy of the light emitted is related
to the electric charge (e) of an electron
and the voltage (V) required to just light
the LED.
In a simplified form,
energy = eV joules
e = 1.6 x 10
-19
coulomb
energy is also = hf
h is Planck's constant
f is photon frequency
so eV = hf
and V = hf/e
A graph of V against f has a gradient of h/e
subject to the assumptions in section 7.
6. Determination of Planck’s constant, h
Use a diffraction grating to view the first
order fringes, as in Experiment 4, and
calculate the wavelength for each LED.
Enter the values in a table, see example.
Calculate the frequency for each
wavelength, using the formula,
f = c/
λλ
λλ
is photon wavelength
c = 3 x 10
8
ms
-1
e.g. for the deep red LED, the wavelength
is 641nm or 641 x 10
-9
metres, so
f = 0.00468 x 10
17
s
-1
= 4.68 x 10
14
Hz
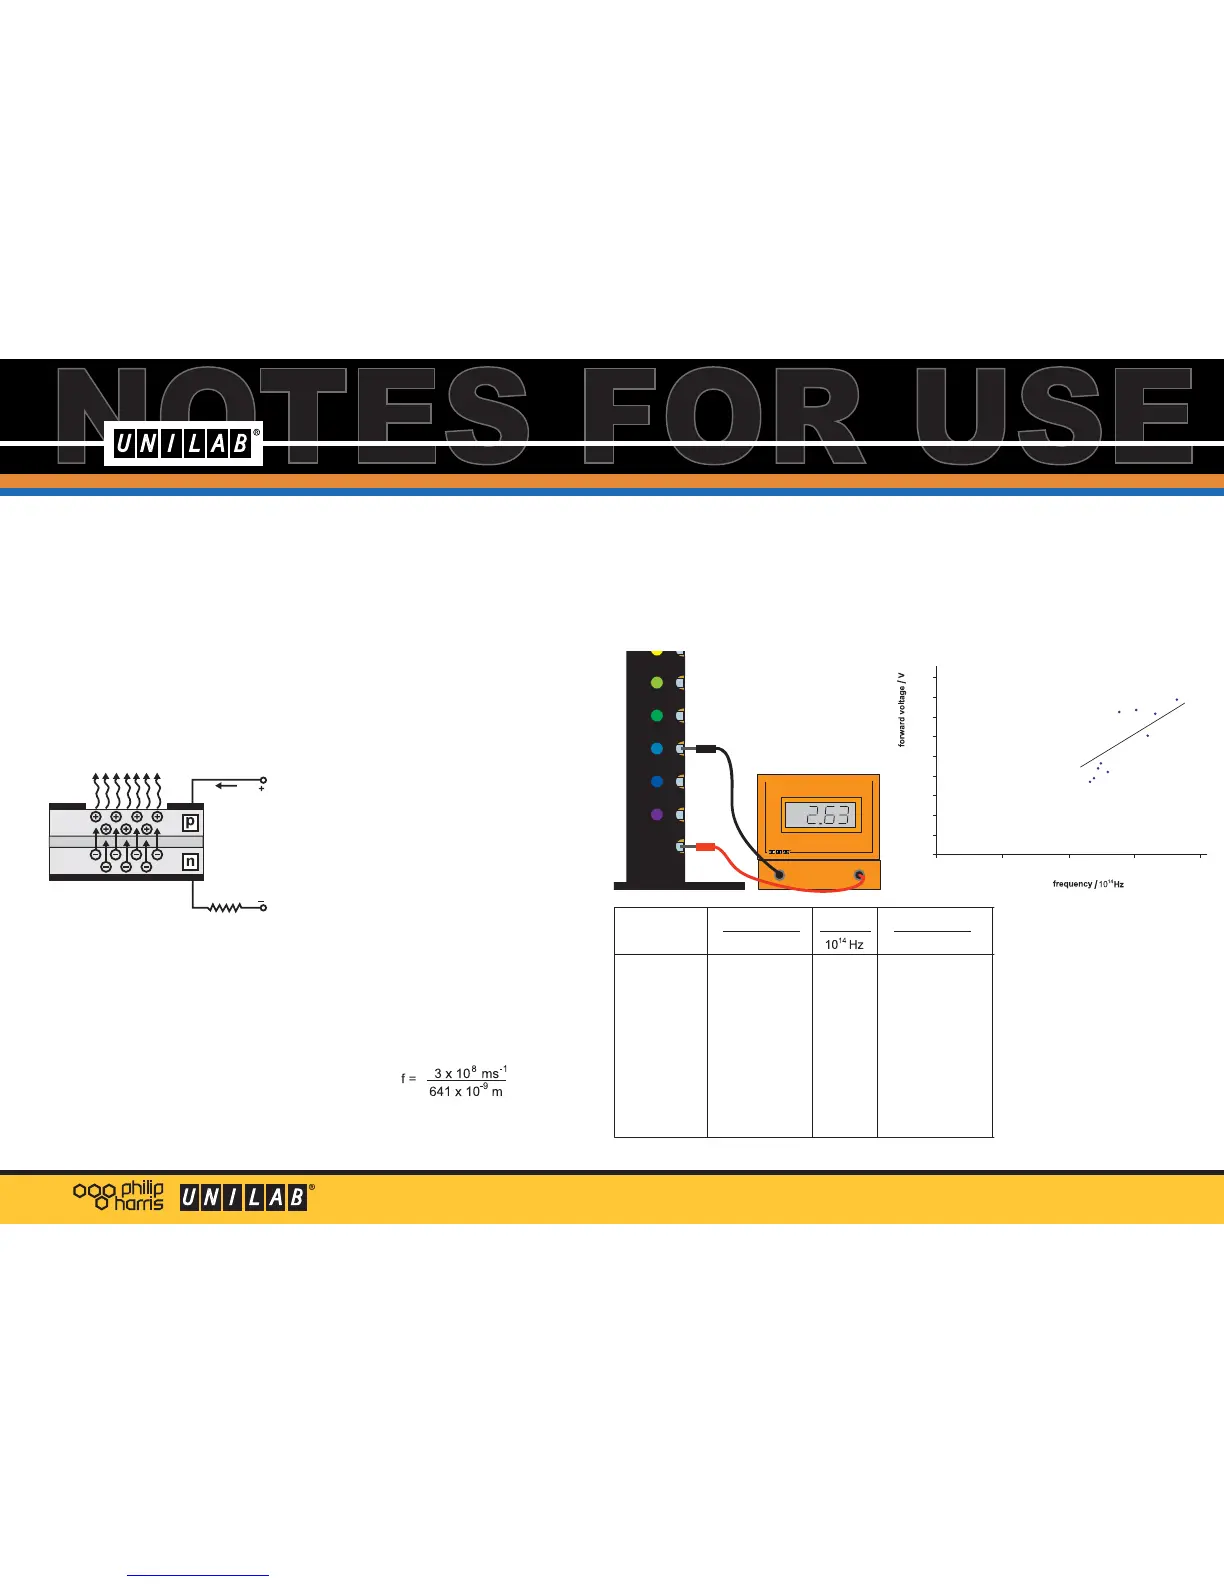
Use a voltmeter(e.g. Unilab Easy Read wth
20V d.c. attachment) to measure the
forward voltage for each of the LEDs.
Connect the positive lead to the metal
contact marked 'common' and touch the
negative lead on the contact next each
LED in turn.
Complete the table with frequency and
forward voltage values for each LED.
Plot a graph of V against frequency, and
draw a line of best fit.
The gradient of this graph is close to
0.5 x 10
-14
So h/e = 0.5 x 10
-14
and e = 1.6 x 10
-19
Finally, h = 8.0 x 10
-34
This value is slightly high,
the accepted value being
6.626 x 10
-34
joule second.
The alternative method of
measuring the voltage
(below) may provide a more
accurate value.
 Loading...