EasyManua.ls Logo

Vaisala HM41 - Menu Navigation; Main Menu

Vaisala HM41
67 pages
To Next Page IconTo Next Page
To Previous Page IconTo Previous Page
Loading...
22
You can change the timescale of
the graph in the
Main menu
.
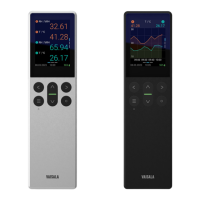
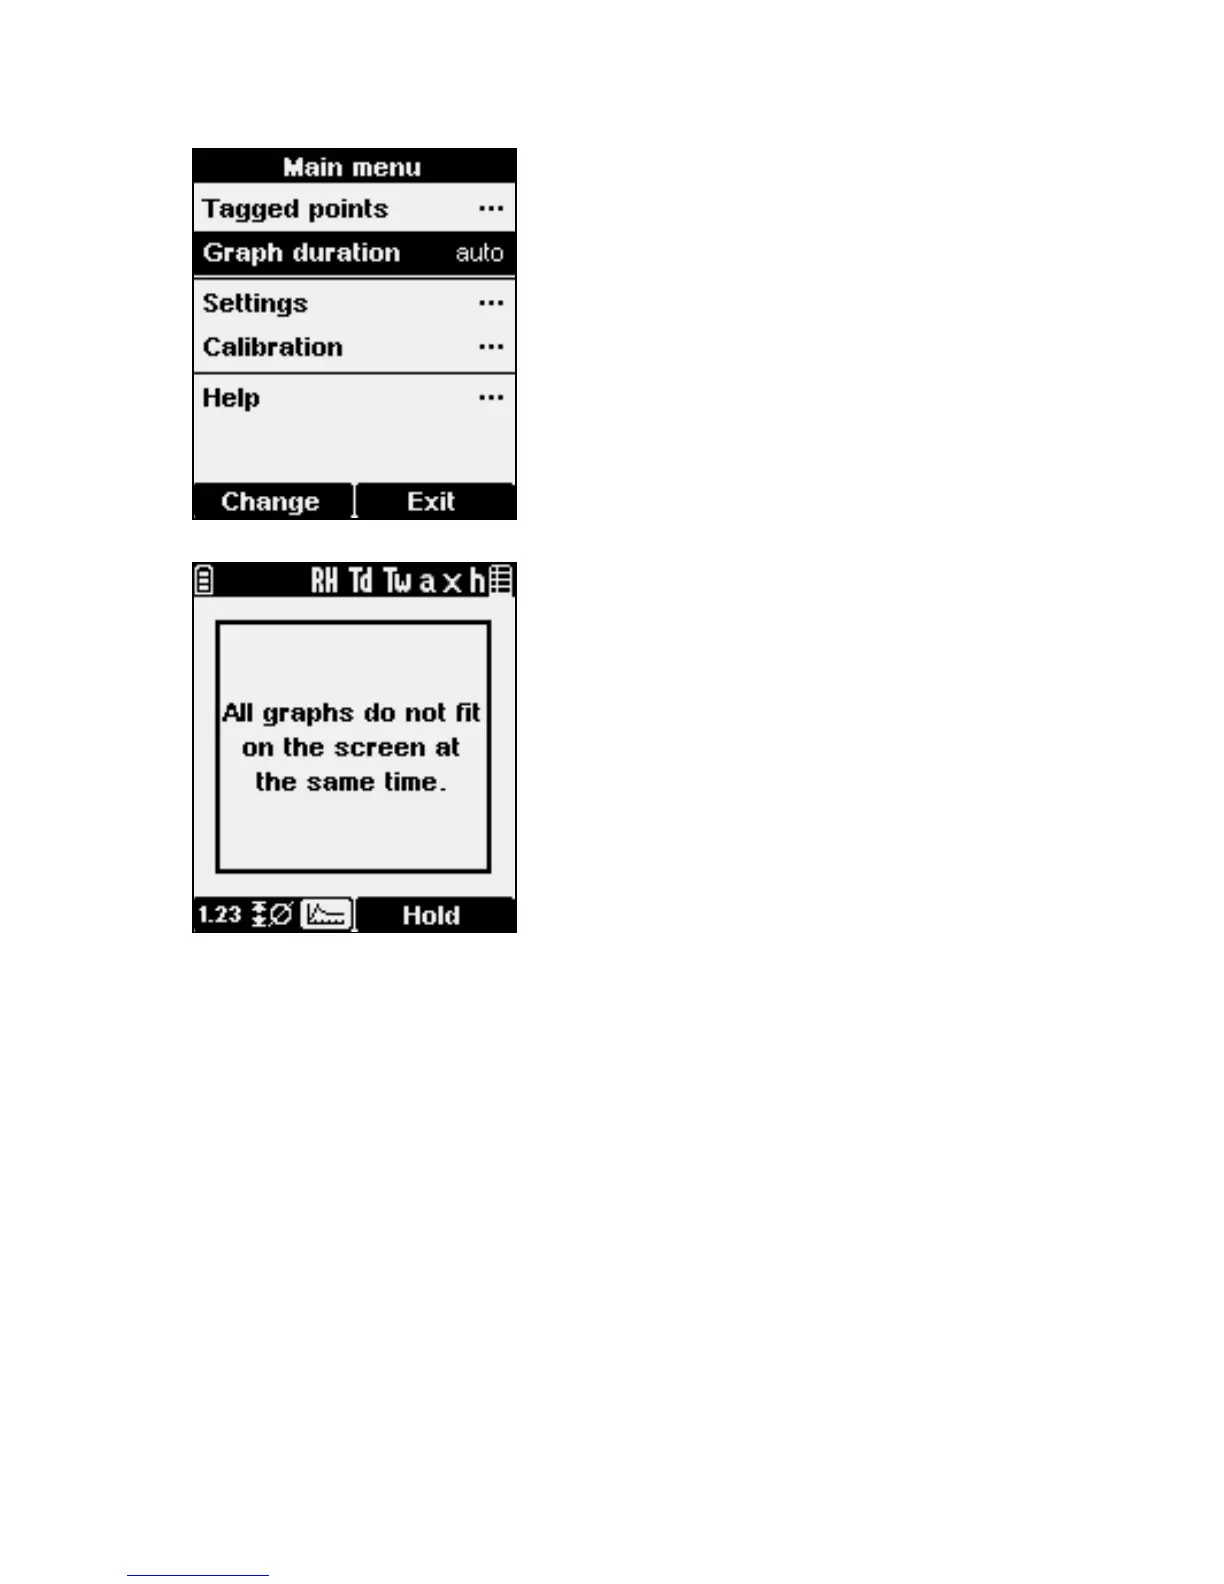
By default, the graph will
automatically change the timescale
to fit the measured data. If you
select a short timescale, only the
most recent data will be visible.
The graph view is not available in
the all parameters view. Select a
single parameter to show the
graph.

Related product manuals