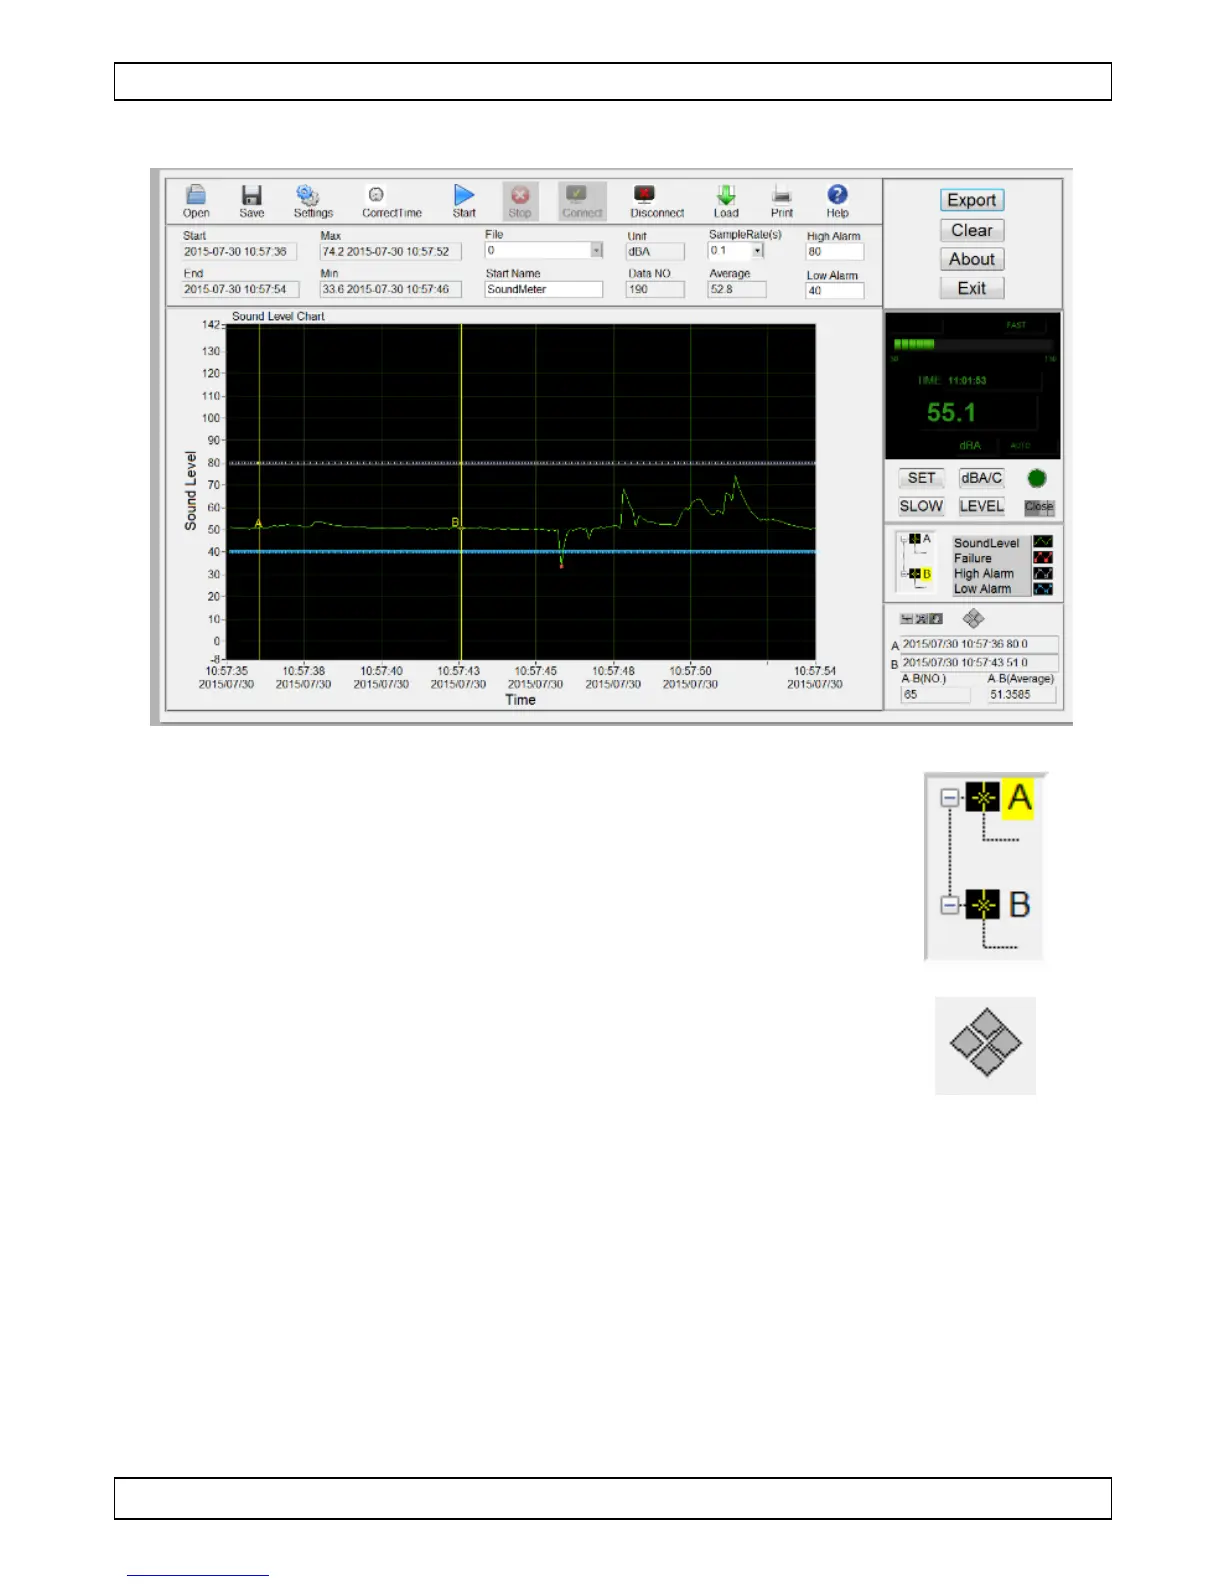
Detailed view of the recorded values is done with
markers. These markers limit the value range, which in
turn can be enlarged and viewed in detail. To determine
the markers:
1. Go to the markers window and select the A marker
by clicking it. The selected marker will be
highlighted in yellow.
2. Place the mouse cursor at the starting point in the
graph window and left-click to set the marker. Click
the diamond button to move your marker.
3. Do the same for marker B and set the ending time.
4. Detailed values are displayed in the bottom left-
hand corner of the screen.
 Loading...