P83134 G
Sheet 2 of 6
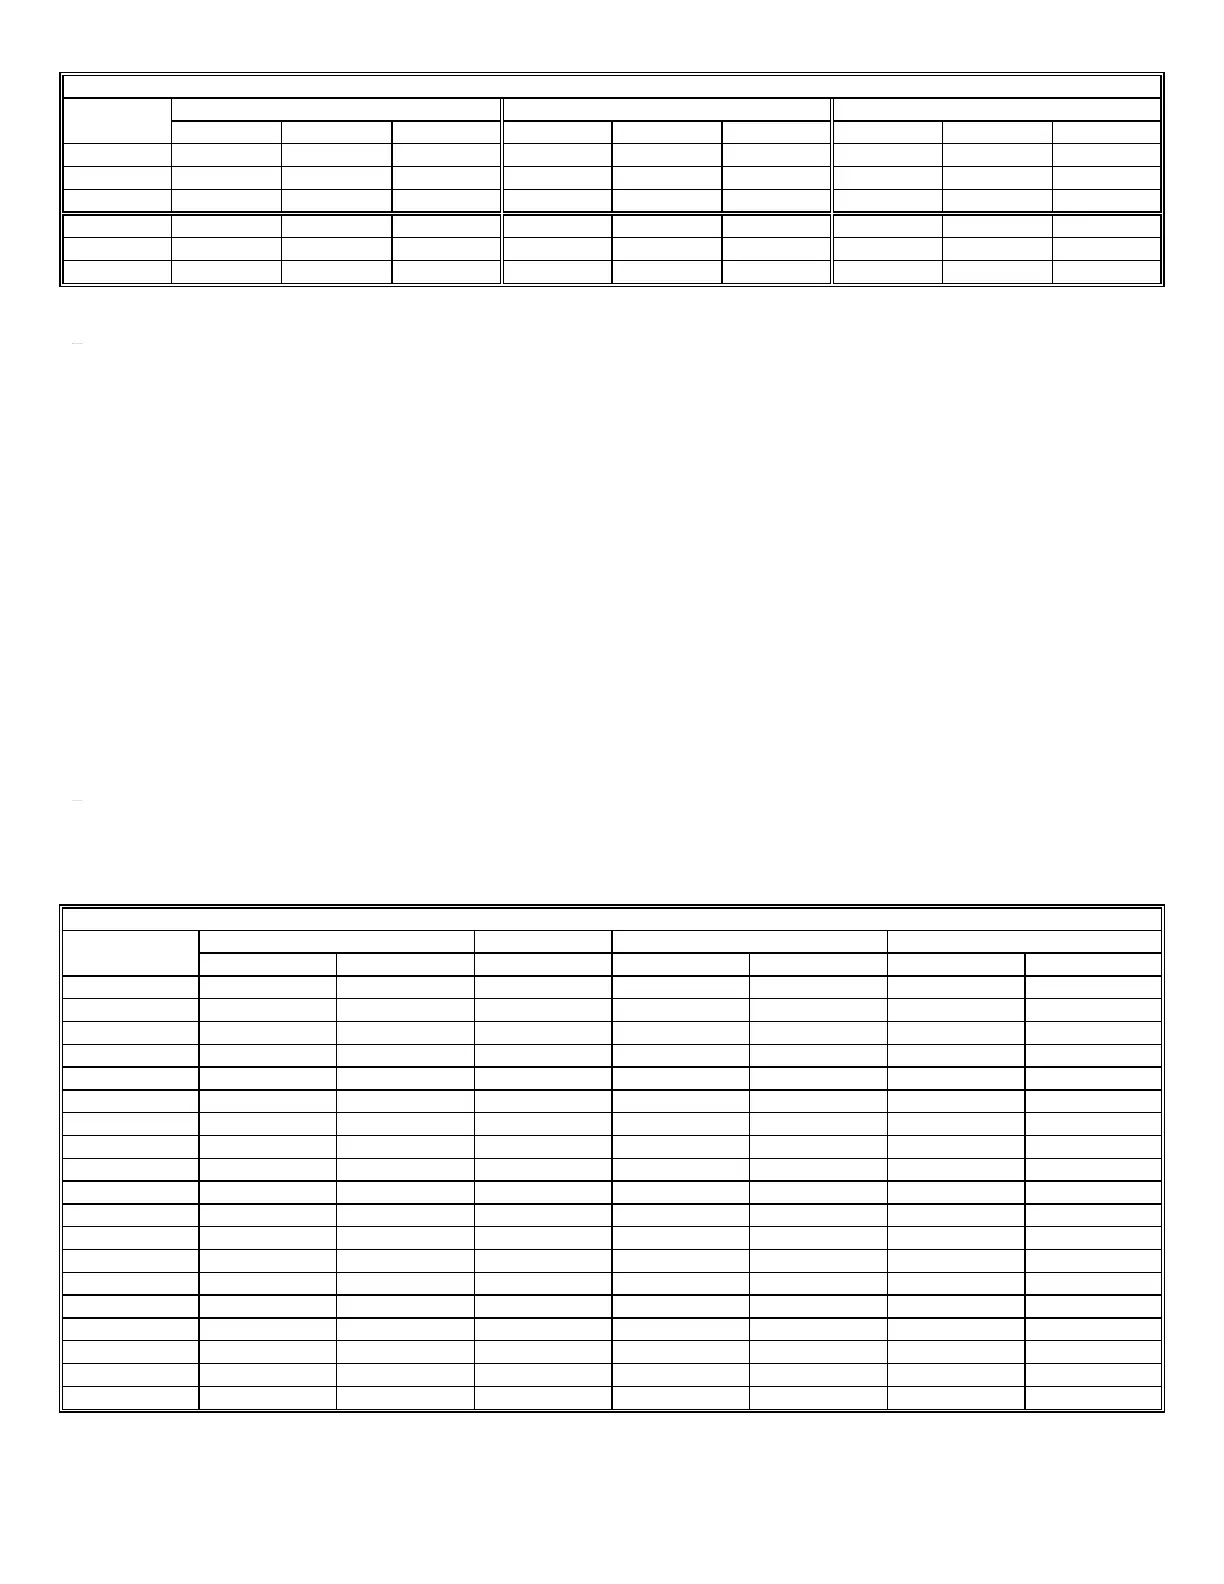
Table 2A: Strobe Current Requirements (AMPS) for 12VDC Models
Voltage Rated Average Current Rated Peak Current Rated Inrush Current
15cd 30cd 15cd* 15cd 30cd 15cd* 15cd 30cd 15cd*
10.5VDC .160 .235 .220 .340 .560 .470 .300 .500 .440
12.0VDC .160 .235 .220 .340 .560 .470 .300 .500 .440
15.6VDC .160 .235 .220 .340 .560 .470 .390 .650 .470
10.5VFWR .175 .240 .230 .475 .730 .660 .420 .700 .620
12.0VFWR .175 .240 .230 .475 .730 .660 .420 .700 .620
15.6VFWR .175 .250 .240 .475 .730 .660 .545 .910 .660
Note: All VFWR voltage ratings are measured with a DC volt meter. Multiply VFWR voltage by 1.11 to convert to VRMS.
WARNING: MAKE SURE THAT THE TOTAL AVERAGE CURRENT, TOTAL PEAK CURRENT AND TOTAL
INRUSH CURRENT REQUIRED BY ALL APPLIANCES THAT ARE CONNECTED TO THE SYSTEM’S PRIMARY
AND SECONDARY POWER SOURCES AND APPLIANCE CIRCUITS DO NOT EXCEED THE POWER SOURCES’
RATED CAPACITY OR THE CURRENT RATINGS OF ANY FUSES ON THE CIRCUITS TO WHICH THESE
APPLIANCES ARE WIRED. OVERLOADING POWER SOURCES OR EXCEEDING FUSE RATINGS COULD RESULT
IN LOSS OF POWER AND FAILURE TO ALERT OCCUPANTS DURING AN EMERGENCY, WHICH COULD RESULT
IN PROPERTY DAMAGE AND SERIOUS INJURY OR DEATH TO YOU AND/OR OTHERS.
When calculating the total average, peak and inrush currents: Use Table 2 and 2A to determine the highest value of “Rated Average
Current” for an individual strobe (across the expected operating voltage range of the strobe) to determine the highest value of “Rated
Inrush Current” or “Rated Peak Current” (whichever is higher) of an individual strobe (across the expected voltage range of the
strobe) then multiply these values by the total number of strobes; be sure to add the currents for any other appliances, including
audible signaling appliances, powered by the same source and include any required safety factors.
If the inrush current or peak current exceeds the power supplies’ inrush capacity, the output voltage provided by the power supplies
may drop below the listed voltage range of the appliances connected to the supply and the voltage may not recover in some types of
power supplies. For example, an auxiliary power supply that lacks filtering at its output stage (either via lack of capacitance and/or
lack of battery backup across the output) may exhibit this characteristic.
CAUTION: Strobes are not designed to be used on coded systems in which the applied voltage is cycled on and off.
LIGHT DISTRIBUTION:
Table 3: Horizontal Plane
Horizontal 15cd 15cd* 30cd 75cd
Angle (in deg.) UL Min. Typ. 15cd Typ. 15cd* UL Min. Typ. 30cd UL Min. 75cd
0 15.0 21 100 30.0 42 75.0 90
5 13.5 20 75 27.0 40 67.5 92
10 13.5 20 38 27.0 40 67.5 89
15 13.5 20 28 27.0 40 67.5 86
20 13.5 20 22 27.0 40 67.5 86
25 13.5 20 19 27.0 40 67.5 83
30 11.3 19 19 22.5 38 56.3 77
35 11.3 17 17 22.5 34 56.3 70
40 11.3 17 17 22.5 34 56.3 65
45 11.3 15 16 22.5 30 56.3 62
50 8.3 10 15 16.5 20 41.3 42
55 6.8 8 15 13.5 16 33.8 35
60 6.0 8 15 12.0 16 30.0 33
65 5.3 8 15 10.5 16 26.3 31
70 5.3 8 15 10.5 16 26.3 31
75 4.5 8 15 9.0 16 22.5 31
80 4.5 7 15 9.0 14 22.5 30
85 3.8 7 15 7.5 14 18.8 27
90 3.8 6 14 7.5 13 18.8 26
* 15cd models are UL Listed at 15cd and meet 75cd on axis.
 Loading...