Ziehm Imaging, Inc. Vision Installation Manual MAN 06-0015, Rev. A Page 20
Maintenance Report: Beam Quality
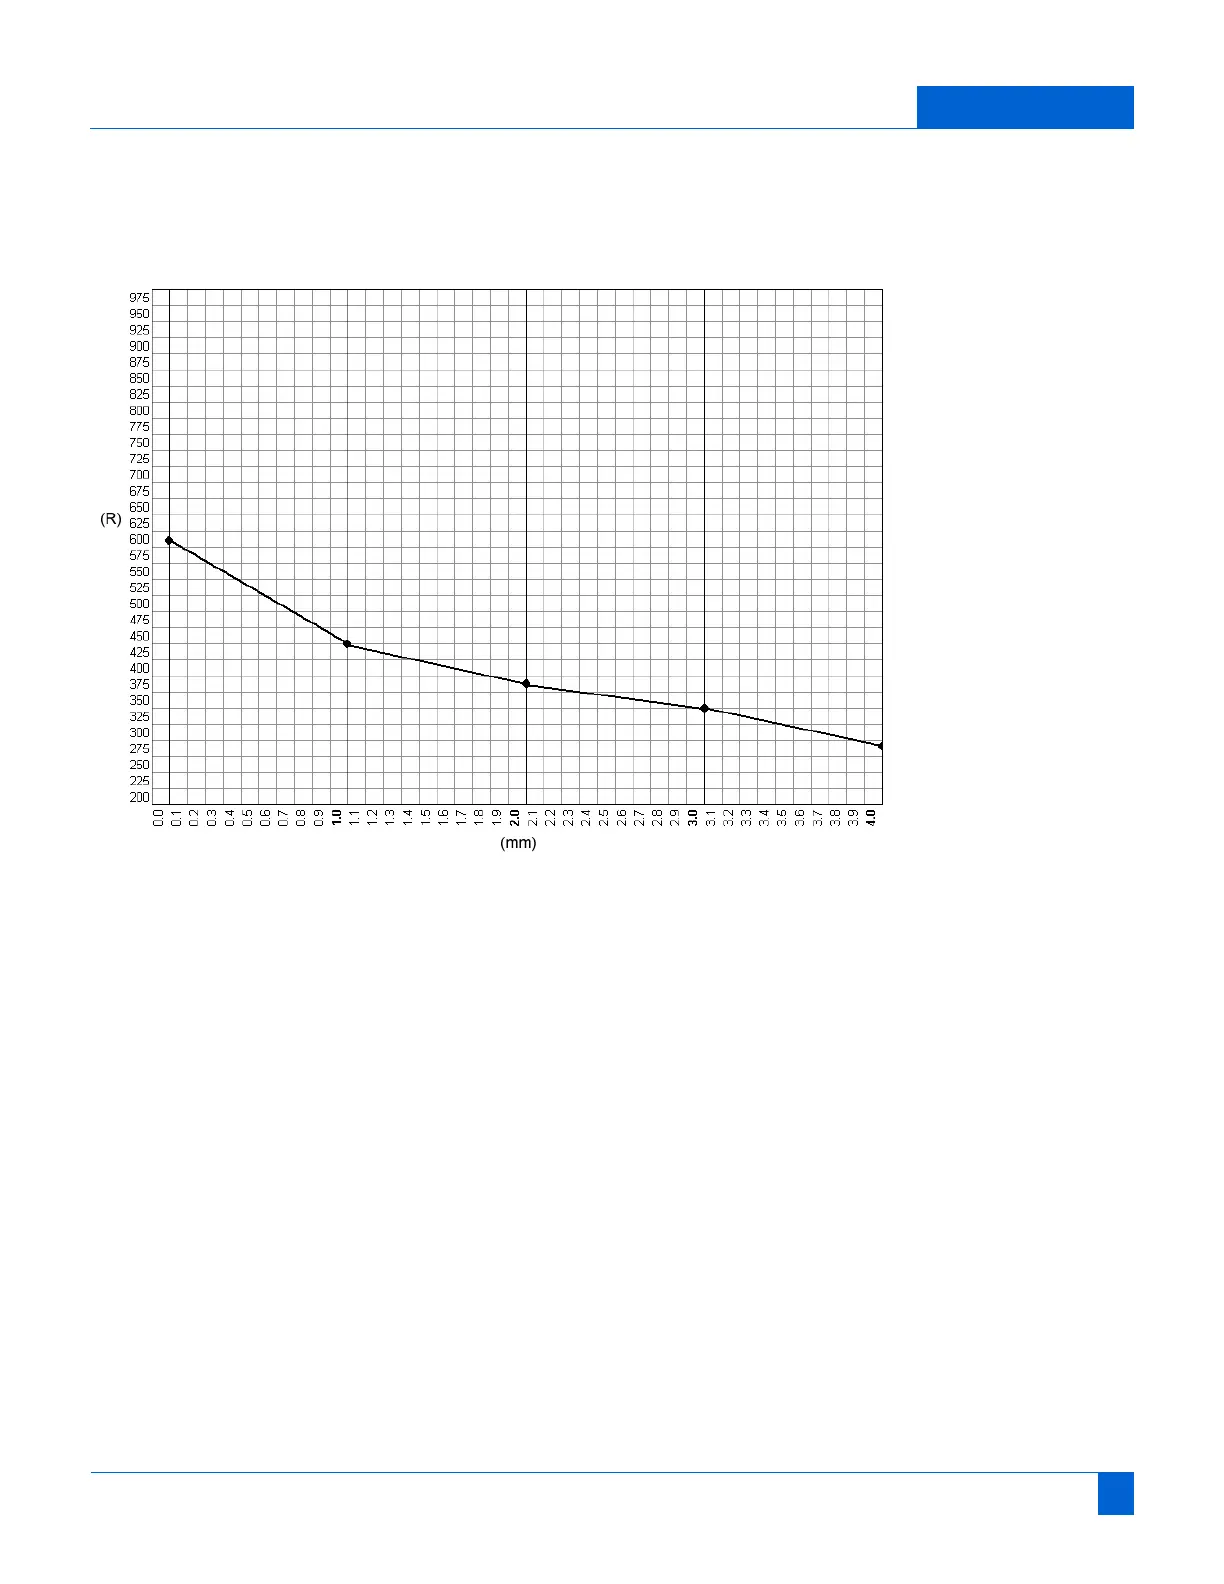
11. Plot the exposure data, as shown below.
Note: A blank graph form is included at the end of this document.
Fig. 8 Exposure Data Plot
12. Under the first data point, place a data point that is one-half the value. In this case,
300.
13. Draw a horizontal line from the data point to the curve.
14. Draw a vertical line from the point of this intersection to the horizontal axis (see
Data Plot Figure 10 above.
 Loading...