53
Cross Hair Gauge
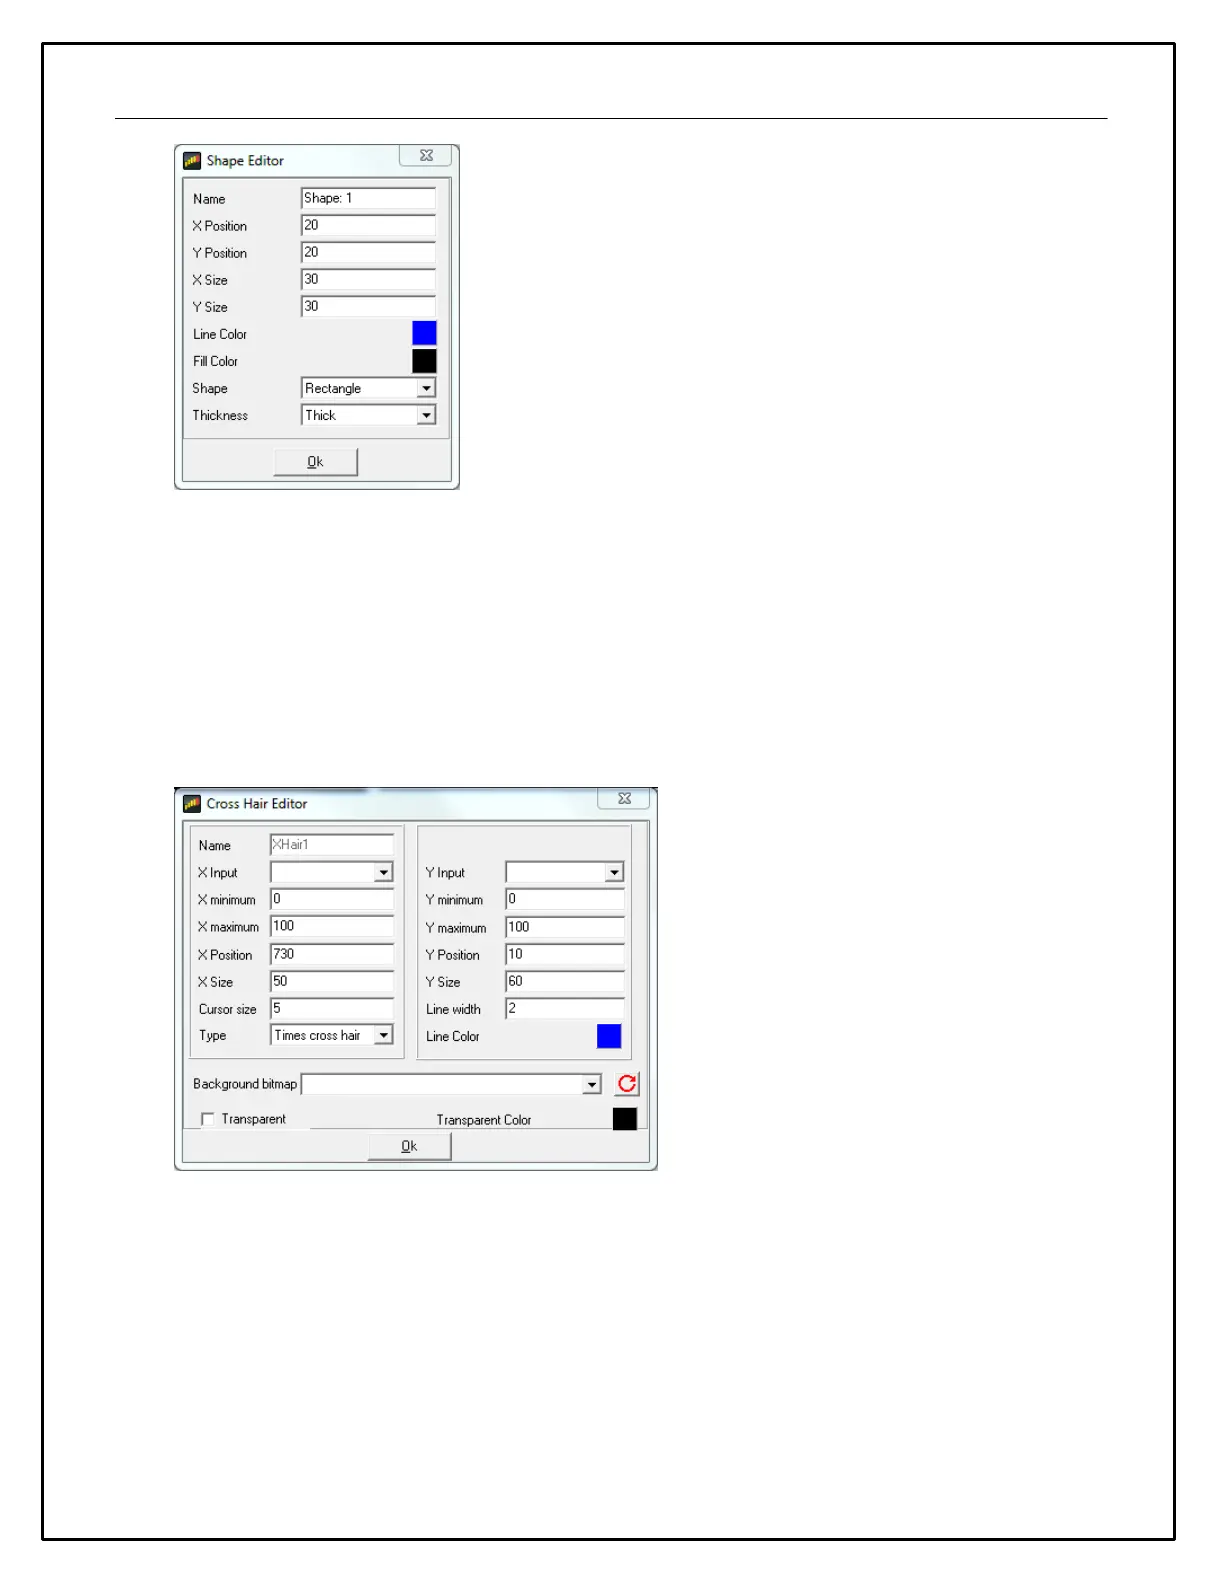
The Cross Hair gauge uses two inputs to move a cross hair around a box. The cross hair gauge has the
following special properties:
· XInput, YInput specify the inputs for the X and Y axes of the gauge.
· X Minimum, Y Minimum specify the starting values for the X and Y axes.
· X Maximum, Y Maximum specify the end values for the X and Y axes.
· Cursor Size is the size of the cross hair cursor.
· Background Bitmap can be used to specify a bitmap that will be shown behind the cross hairs, This can
be used to clarify the meaning of a particular position for the cross hair.
Historical Graph
The Historical Graph gauge is used to show the trend of one or more outputs in the form of a y-t graph. The
Historical Graph gauge has the following special properties:
· Time Base - This is the width of the x axis in seconds. When a page with a historical graph gauge is first
selected, the data is drawn from the left hand side of the graph (t=0). As the time progresses, the lines
progress towards the right hand side of the graph. Once t = time base, the graph scrolls to the left to
make more space available for drawing the lines.
· Input Count - The number of lines (outputs) drawn in this graph.
· The Inputs box allows the details of each line to be specified:
· Input Index - Selects which line the following settings apply to.

 Loading...