4-8 Subject to Export Control, see Cover Page for details.
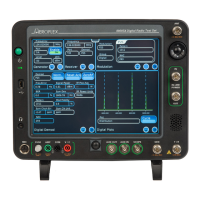
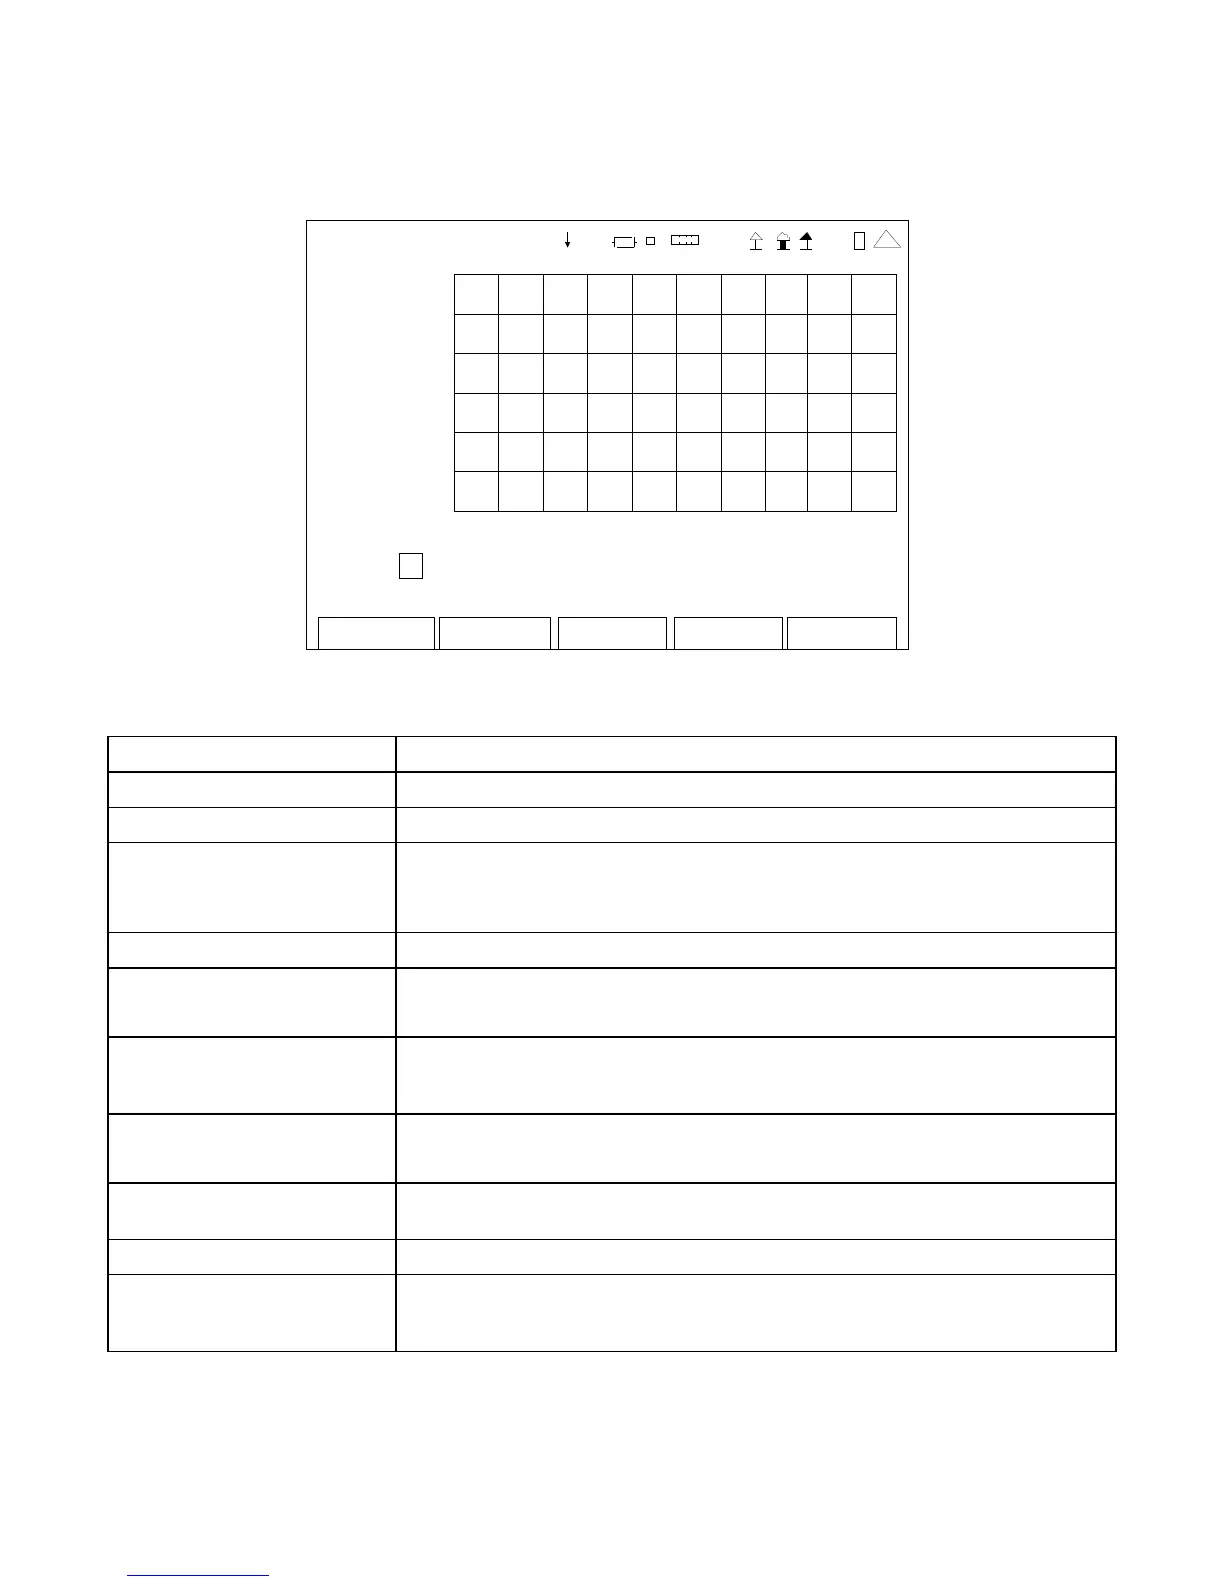
4-3-2. SPECTRUM ANALYZER SCREEN FEATURES AND FUNCTIONS (cont)
Edit Return
Ho l d
Nor
PBw
RBWe(Hz)
9 244 .79 2
Pbw(dB m)
-99 .58 3
Preamp
O ff
41 20 29
ANALY ZER
-1 0
dB m
-7 0
49.5 MHz 50.5
Marker: 1 Off Freq: 2.0000 MHz Delta: ---
Max Left Right Ampl: --- Delta: ---
(Marker Mode)
SCREEN FEATURE FUNCTION
RBWe(Hz) Displays the equivalent resolution bandwidth.
Pbw(dBm) Displays the total power inside the power bandwidth markers.
Marker Used to select and enable one of two markers on the Graphical
Display.
Select: 1 or 2
Marker Status Used to set the Marker selected to ON or OFF.
Freq Used to select the Spectrum Analyzer center frequency.
Range: 2.0000 to 1000.0000 MHz in 0.0001 MHz increments
Delta (Top) Displays the Delta in SWR/Return Loss between the Active Marker
selected in the Marker Field and the Marker selected in the Delta
Field.
Move/Min/Max Used to move the Active Marker on the Graphical Display.
Select: Max, Min or Move
Left Right Used to move the Active Marker selected in the Marker Field to the
left or to the right on the Graphical Display.
Ampl Displays the signal amplitude.
Delta (Bottom) Displays the Delta in Frequency or Distance between the Active
Marker selected in the Marker Field and the Marker selected in the
Delta Field.
 Loading...