INSTRUMENTS
04.6
11-04
RoGator 418
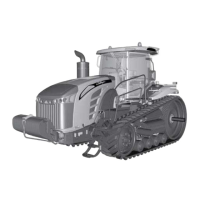
The Graph Display
The graph display shows data trends in one large
window and is analogous to a traditional data plot-
ter.
This mode is selected by pressing any of the four
grey keys to show the top-level menu icons and
then pressing key #3.
Data is shown in graph form, with the most recent
data scrolling from the right of the display towards
the left. The viewed time range can be adjusted in
the configuration menu from 2, 10 or 30 minutes
up to 1, 2, 4 or 8 hours.
The maximum and minimum values of the Y axis
(defining the span of readings displayed) are ad-
justed automatically to give the optimum view of
the visible data.
The data to be displayed can be selected by re-
peatedly pressing key #3 whilst in the graph dis-
play mode.
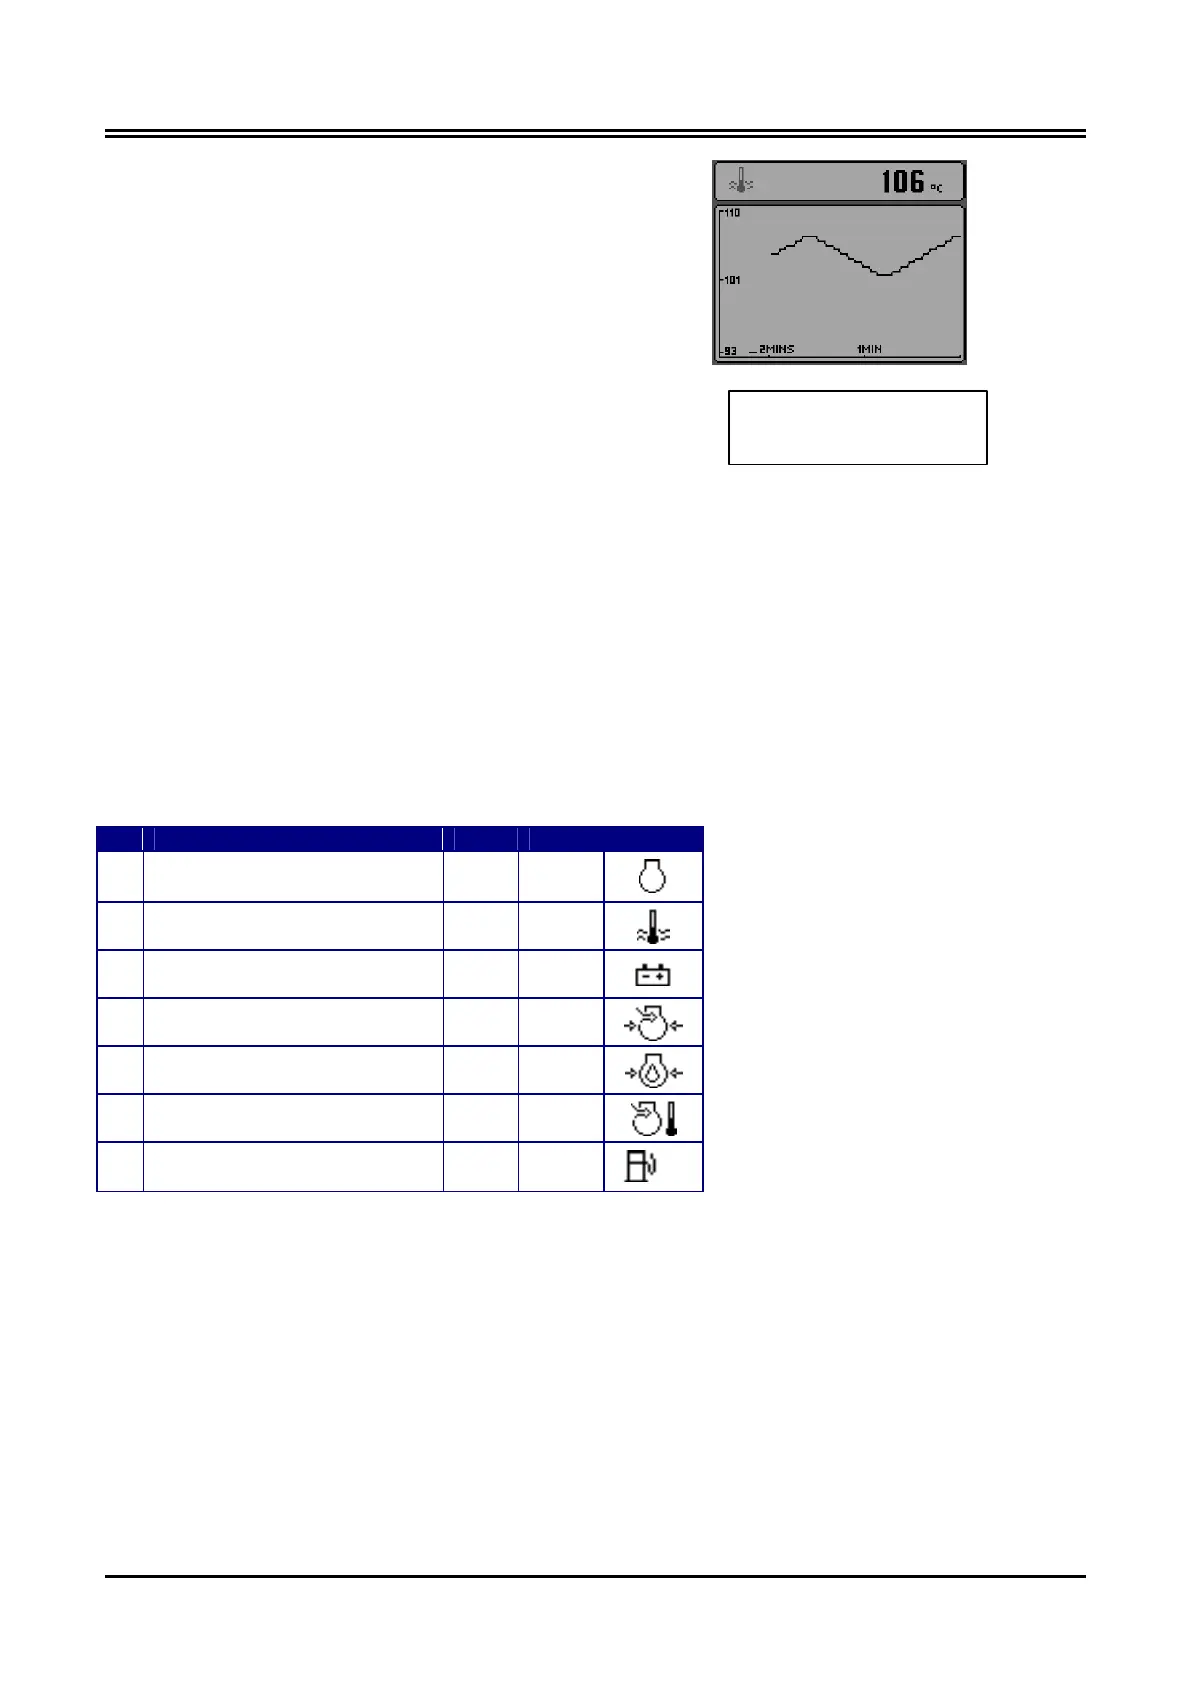
The Quad and Graph Parameters
Following is a list of engine parameters that can be displayed in the Quad and Graph screens:-
Parameter Quad Graph Icon
Engine Speed (rpm)
ü ü
Coolant Temperature
ü ü
Battery Voltage
ü ü
Turbo Pressure
ü ü
Engine Oil Pressure
ü ü
Inlet Manifold Temperature
ü ü
Fuel Rate -
ü
Representative view of the
graph display, showing coolant
temperature.
 Loading...