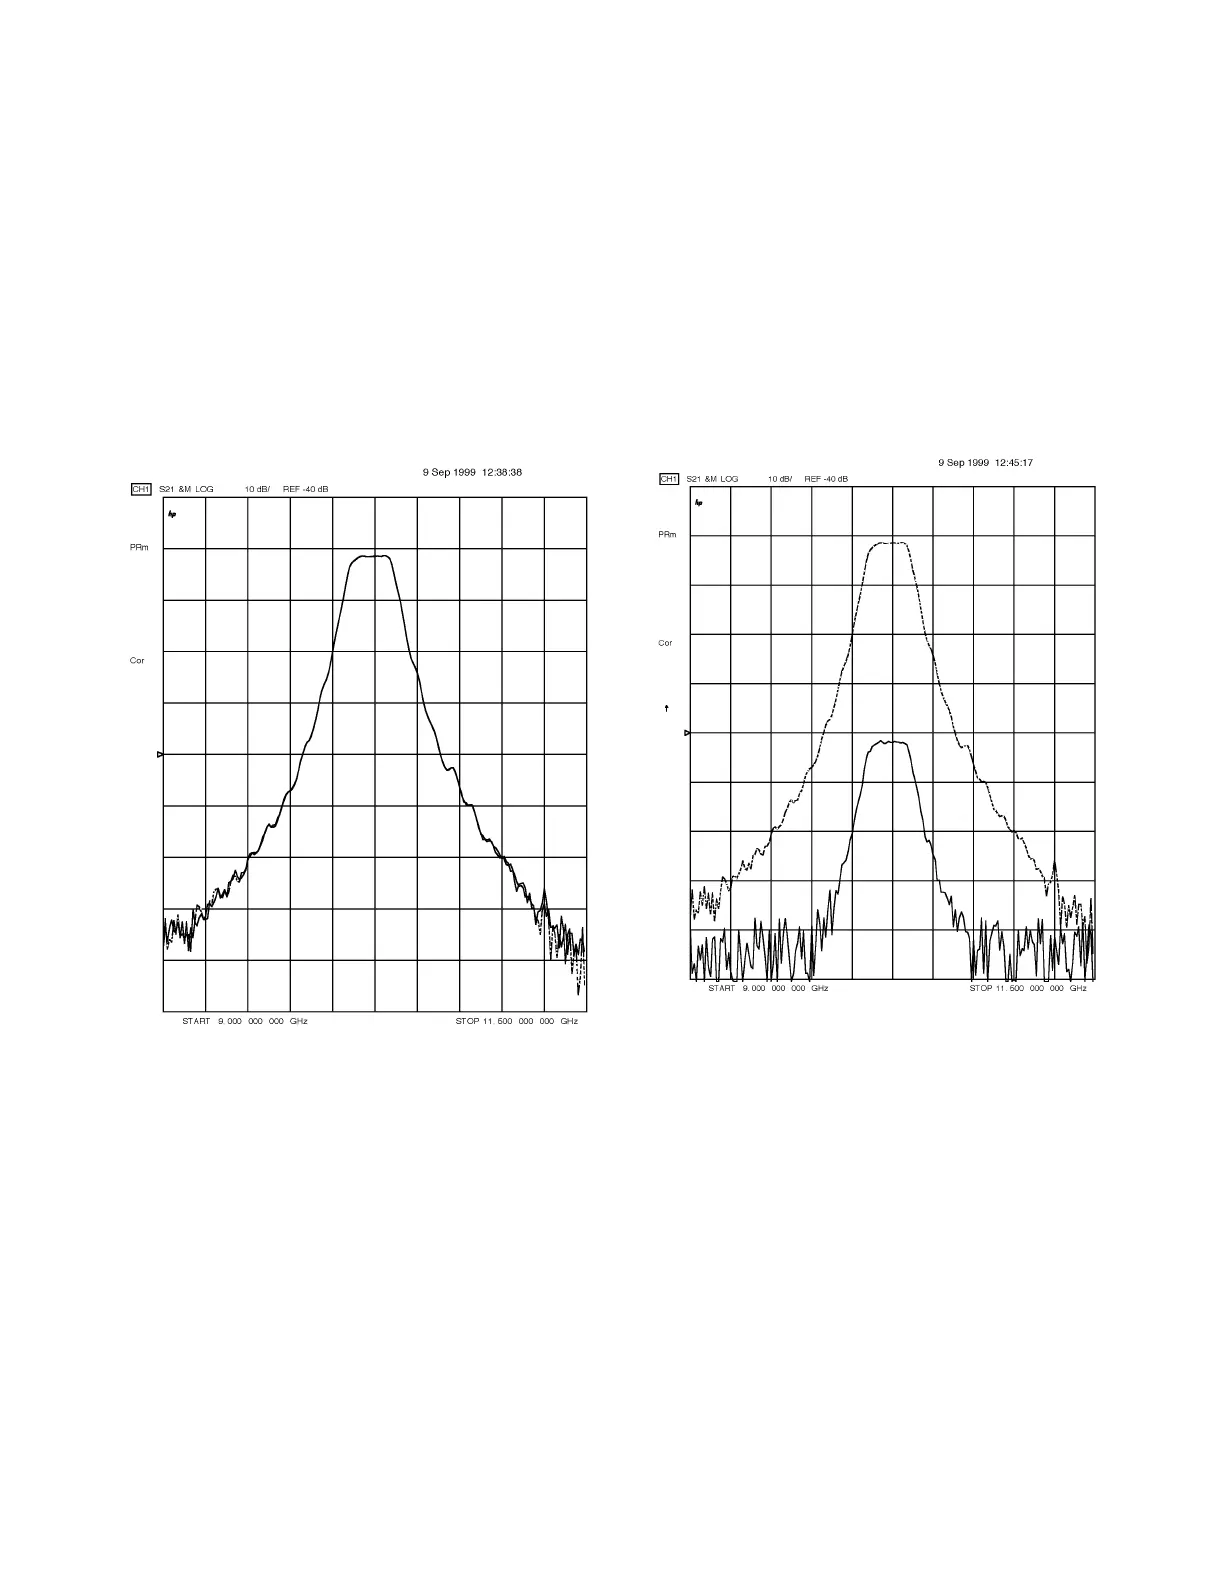
In Figure 5, we see the result of a low PRF measurement
in point-on-pulse mode. This shows the DUT’s frequen-
cy response to a series of RF pulses. The analyzer was
triggered (using external trigger on point) during each
RF pulse until 201 samples were taken. The delay
between the trigger signal and the RF pulse was adjust-
ed so that the sample was taken near the center of each
pulse. The nonpulsed response of the filter (shown as a
dashed line) is indistinguishable from the pulsed
response. Again we see there is no loss of dynamic
range. An important point to note is that the maximum
external trigger rate for the 8720ES is approximately
250 Hz, so this method cannot be used for pulse repeti-
tion rates that exceed this. This can become an impor-
tant consideration for reflection measurements.
Measurement Conditions:
Frequency: 9 to 11.5 GHz
Number of points: 201
IF bandwidth: 1000 Hz
Pulse width: 5 ms
Pulse period: 200 ms
Trigger: external on point
Delay: 2 ms
Figure 5. Point on pulse
High PRF transmission example
In this example we are operating on a single spectral line,
as first described under the theory section for high PRF
measurements. This approach requires that we account
for pulse desensitization. The narrowest IF bandwidth on
the 8720ES is 10 Hz, so the smallest PRF which allows the
analyzer to focus on a single spectral line should be at
least 20 Hz. For a PRF between 20 Hz and 20 kHz, choose
an IF bandwidth less than half the PRF. This ensures that
partial responses are eliminated from the skirts of the IF
bandwidth filter. The widest IF bandwidth on the 8720ES
is 6 kHz, so for a PRF greater than about 12 kHz, the ana-
lyzer will select a single spectral line automatically, regard-
less of the IF bandwidth chosen.
Measurement Conditions:
Frequency: 9 to 11.5 GHz
Number of points: 201
IF bandwidth: 1000 Hz
Pulse width: 2 µs
Pulse period: 200 µs
Trigger: internal
Delay: 0 ms
Figure 6. High PRF
Figure 6 shows the filter response to a 5 kHz pulse train.
Notice that no external triggering is required. Notice the
decrease in the magnitude response when compared to
the original (dashed line). Though it is difficult to read
precisely from the figure, the decrease is about 40 dB.
This agrees well with the formula for pulse desensitization.
Calibration for this measurement was done with the pulse
modulator biased on continuously. Pulse desensitization
can be eliminated by calibrating under pulsed conditions,
however, there will be an equivalent rise in the noise floor.
See the calibration section for a discussion of this.
7
 Loading...


