Transmission examples
Normally, pulsed measurements are made on active
devices. For illustration purposes we will measure a
band pass filter, so that we can compare the pulsed
response to a well characterized steady state response.
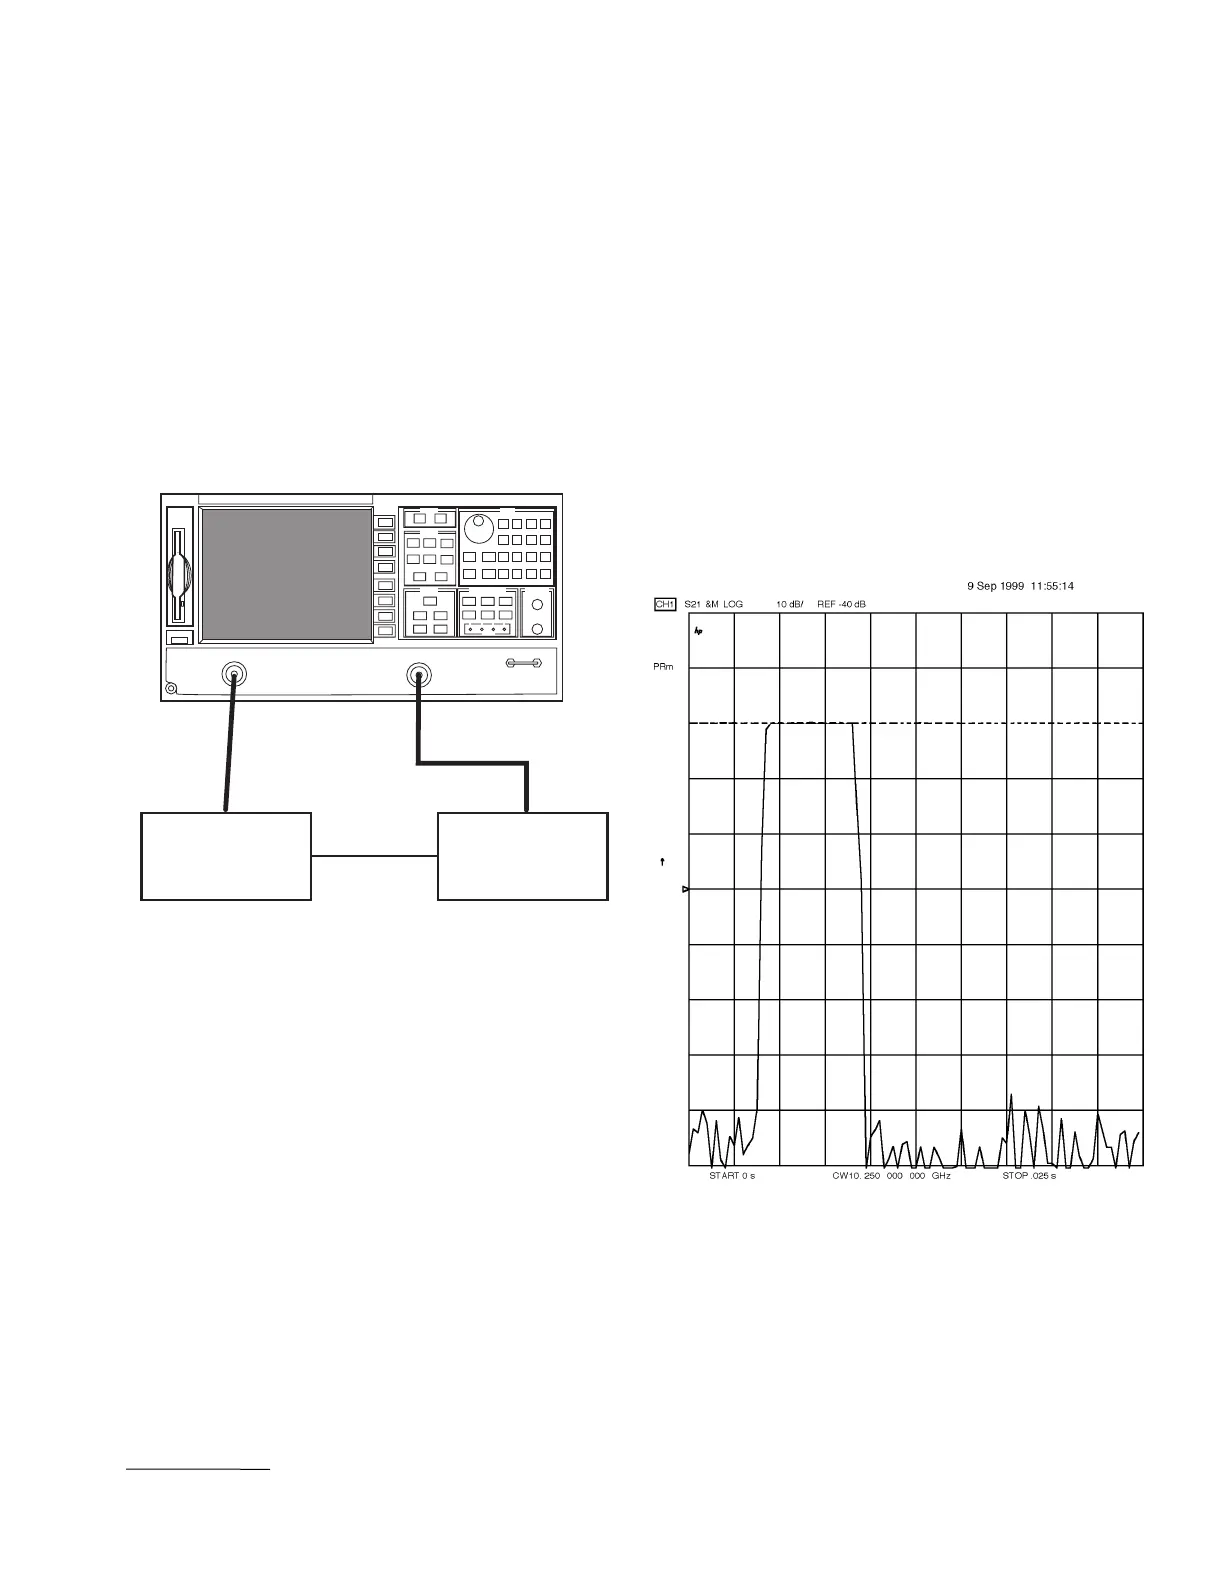
Figure 3 shows a typical transmission measurement
setup. The pulse modulator is connected to port 1 (the
driving port) of the 8720ES, and the DUT is connected
between the pulse modulator and port 2. For these
measurements we are using a simple response calibra-
tion. The pulse modulator is an 11720A and the trigger
control is provided by an 8112A.
1
When a specific setup
parameter is not given, the analyzer default was used.
Figure 3. Simple transmission set up
Low PRF transmission examples
In Figure 4, we see the result of a low PRF measurement
in pulse-profile mode. This shows the DUT’s response
over time to a pulse of RF energy at a CW frequency.
The analyzer was triggered once at the beginning of the
sweep (using external trigger on sweep), and allowed to
free run until 101 samples were taken. The non-pulsed
response of the filter is shown as a dashed line, and the
pulsed response is shown as a solid line.
After the analyzer is triggered, we see only the noise
floor until the moment the RF pulse comes on. Once the
pulse is initiated, the response rises rapidly to match the
non-pulsed response of the filter. After the RF pulse is
cut off, the response diminishes rapidly to the noise
floor once again. Notice that because the pulse width is
much wider than the analyzer response time, there is no
loss of dynamic range.
Measurement Conditions:
Frequency: 10.25 GHz
Number of points: 101
IF bandwidth: 6000 Hz
Pulse width: 5 ms
Pulse period: 200 ms
Trigger: external on sweep
Filter center frequency 10.25 GHz
Figure 4. Pulse profile
6
1. Both the 11720A and the 8112A are obsolete products with no current replacements. Pulse modulation must be provided by the user.
 Loading...


