menu in the softkey area. You can then save a screen capture image to a flash drive.!
!
The above sections give only a brief overview of some of the capabilities of the oscilloscope. As
with most things in lab, the best way to become proficient in using an oscilloscope is to use it
frequently. Don’t be afraid to try different things and poke around in some of the menus. If you
press and hold a key, a help screen will pop up with some information about the function
associated with the key. Also, an extensive manual is available on the web site. http://
tuttle.merc.iastate.edu/ee201/lab/agilent2024A.pdf. Reading a thick oscilloscope manual is
certainly not a leisure-time activity. However, there is a nice “Getting Started” section at the
beginning of the manual. If you want to get all the details on some particular function or feature,
you can then dig deeper into the manual.!
!
!
A simple exercise!
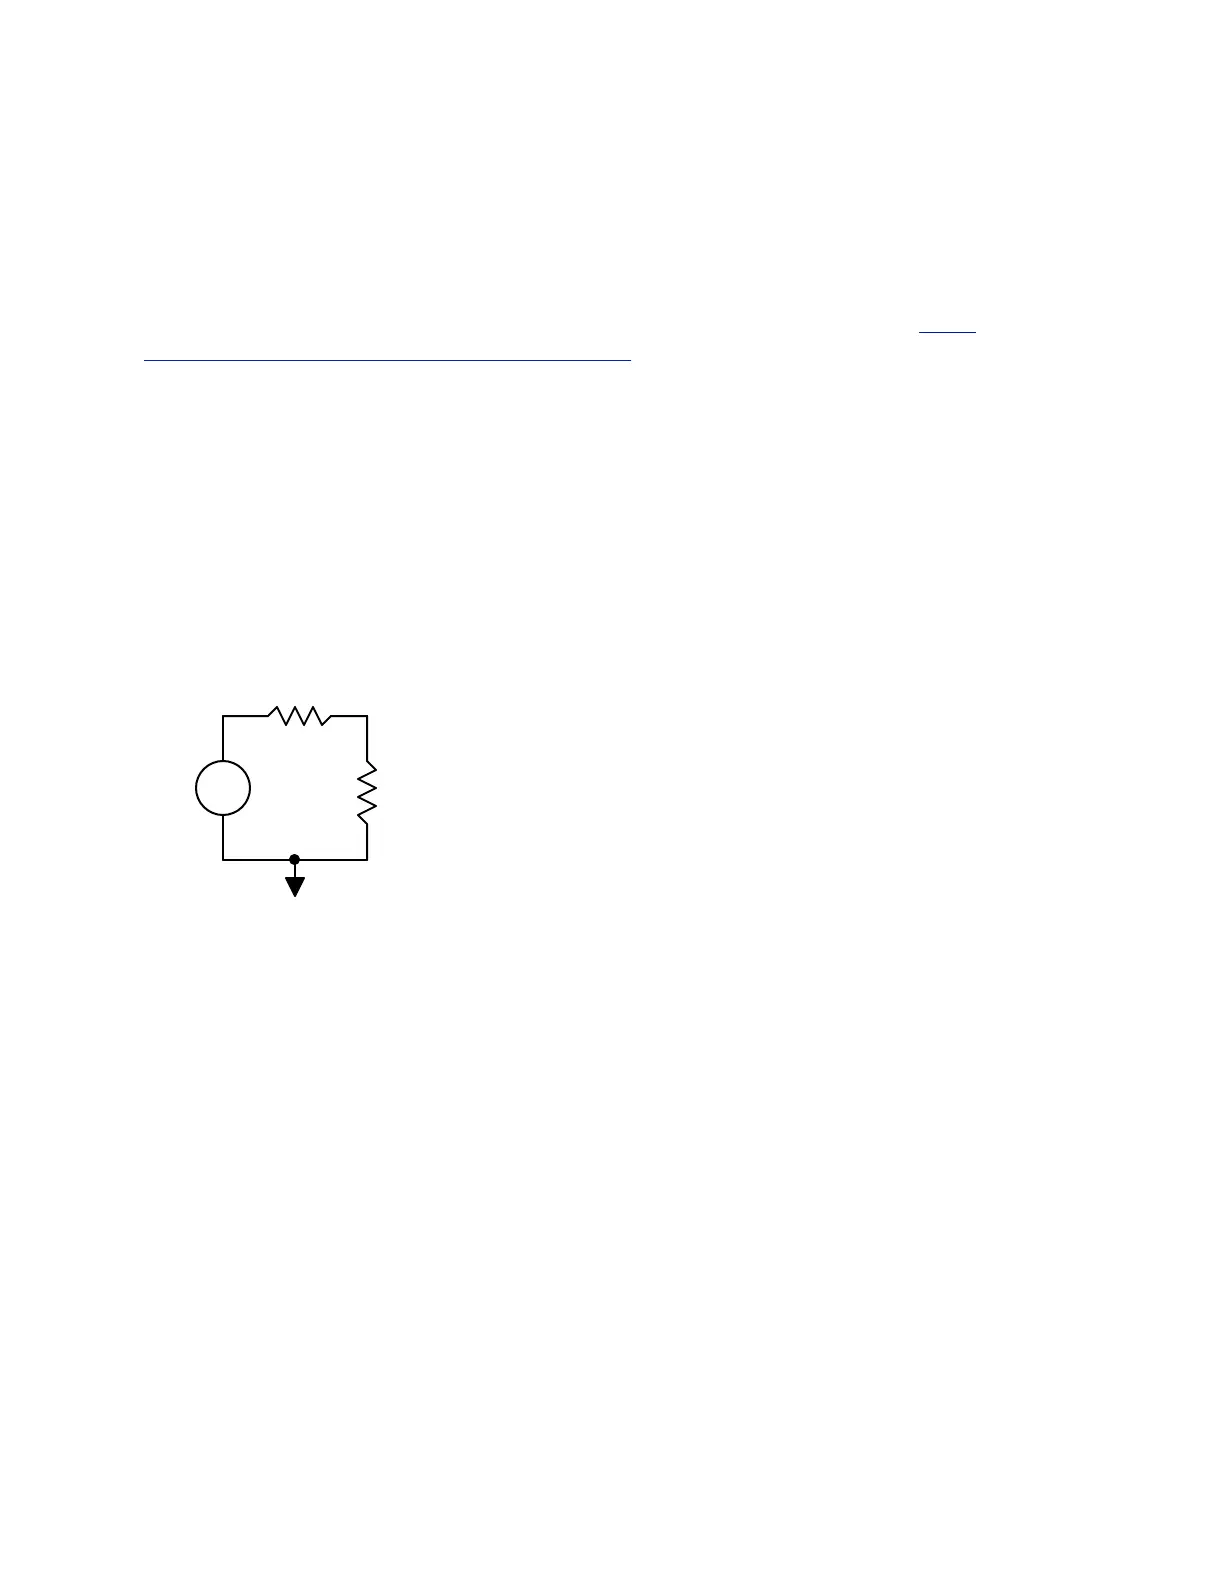
Set up a voltage divider like the one shown in Fig. 2 below. For the source, set up the function
generator set to provide a sinusoid with a 5-V
RMS
amplitude and a frequency of 1 kHz. (See the
function generator tutorial for details of setting up the function generator.) Measure the voltages
on the resistors using the multimeter set to AC volts to ensure that the circuit is working properly.!
!
" !
!
Figure 2. Simple voltage divider circuit for oscilloscope exercise.!
!
1. Power up the oscilloscope.!
2. Make connections using scope probes (or use breadboard leads, if no probes are available).
Use Channel 1 to measure the source voltage – oscilloscope channel negative to the
negative side of the source and oscilloscope channel 1 positive to the positive side of the
source. Use Channel 2 to measure the voltage across R
2
– channel 2 positive lead
connected to the node between R
1
and R
2
. Remember: You do not need to connect the
negative side of Channel 2.!
3. Press the Autoscale key. After a few seconds, the two traces should appear on the
oscilloscope display.!
4. Adjust the time base (horizontal) so that there are about two full periods displayed on the
graph. Note the time scale listed in the upper left-hand corner of the display.!
5. Adjust the vertical position of the two traces so that they are both located at the center line
of the display’s graph. Adjust vertical scaling for Channel 1 so that trace fills as much of
the graph as possible without extending outside the graph. Adjust the vertical scaling of
Channel 2 to match that of Channel 1. Now you can directly compare the source voltage
 Loading...