160 Chapter 4
Downloading and Using Files
Downloading ARB Waveform Data
[status, status_description] = agt_sendcommand(io, 'SOURce:FREQuency 20000000000');
[status, status_description] = agt_sendcommand(io, 'POWer 0');
% define the ARB sample clock for playback
sampclk = 40000000;
% download the iq waveform to the PSG baseband generator for playback
[status, status_description] = agt_waveformload(io, IQData, 'pulsepat', sampclk, 'play', 'no_normscale',
Markers);
% turn on RF output power
[status, status_description ] = agt_sendcommand( io, 'OUTPut:STATe ON' )
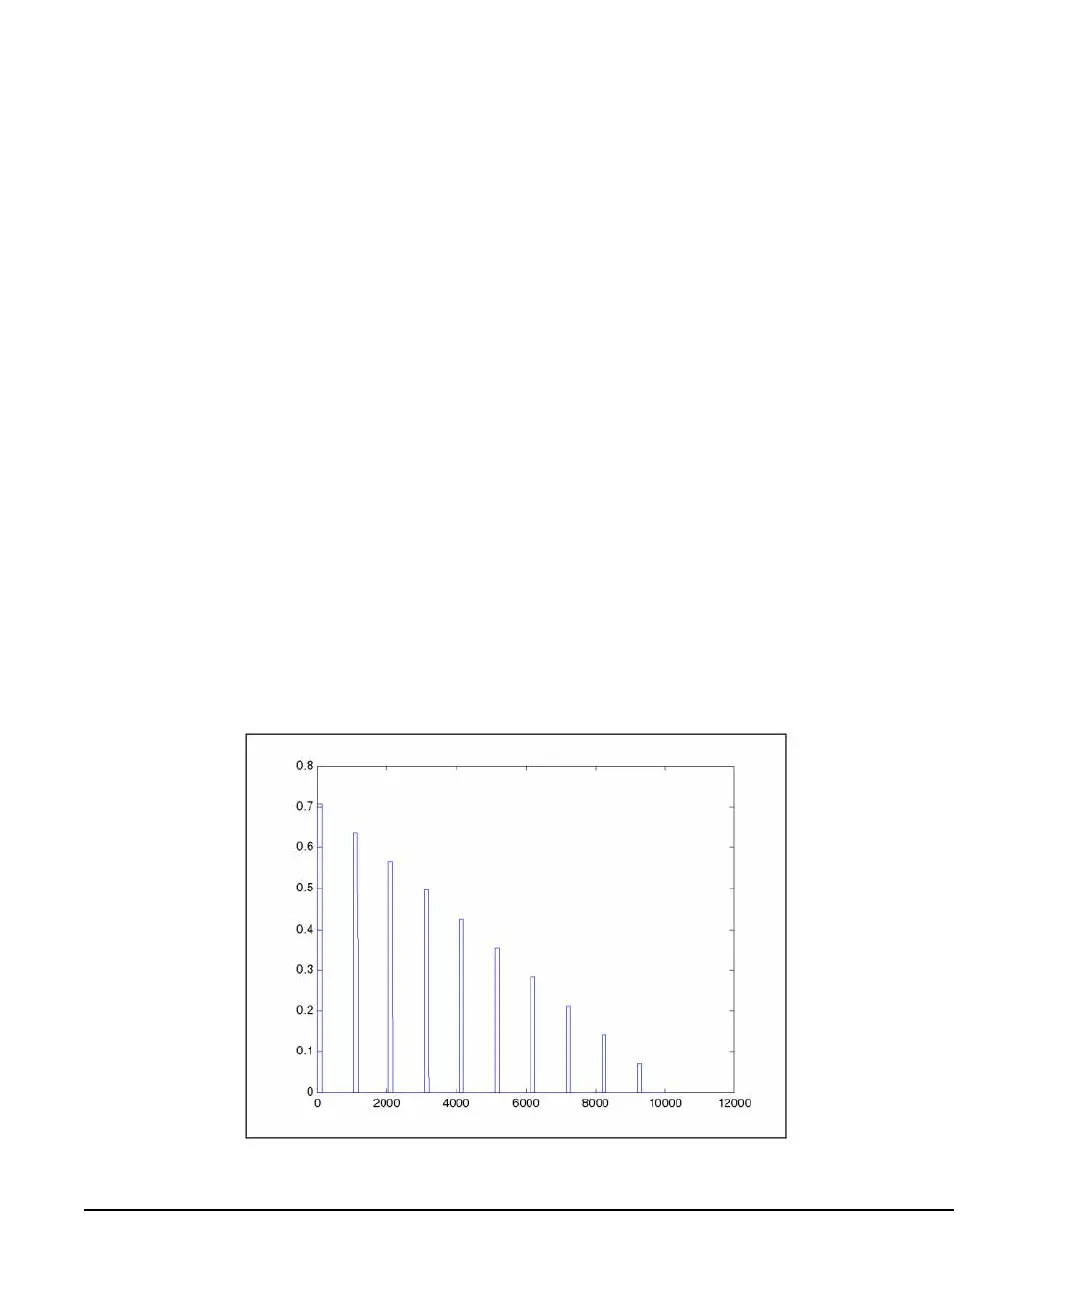
You can test your program by performing a simulated plot of the in-phase modulation signal in Matlab (see
Figure 4-1 on page 160). To do this, enter plot (i) at the Matlab command prompt.
Figure 4-1 Simulated Plot of In-Phase Signal
 Loading...